EBK FINANCIAL ANALYSIS WITH MICROSOFT E
8th Edition
ISBN: 9781337515528
Author: Mayes
Publisher: CENGAGE LEARNING - CONSIGNMENT
expand_more
expand_more
format_list_bulleted
Question
Chapter 3, Problem 2P
a.
Summary Introduction
Adequate information:
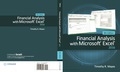
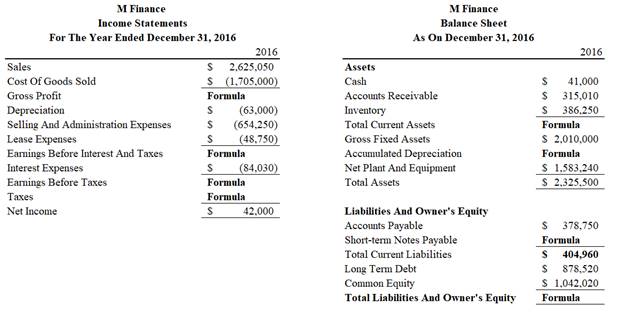
| Ratio | Value | Formula |
| Current Ratio | 1.832716 | |
| Inventory Turnover | 4.414239 | |
| A/R Turnover | 8.333333 | |
| Fixed Turnover | 1.657982 | |
| LTD To Equity | 0.843090 | |
| Times Interest Earned | 1.833333 | |
| Net Profit Margin | 0.016000 | |
| Return On Total Assets | 0.018061 | |
| Return On Equity | 0.040307 |
To compute: Figures marked with ‘ratio’ in the financial statements.
a.
Expert Solution
Explanation of Solution
Sequence of figures calculated and basis:
| Figure Calculated | Ratio Used for Calculation | Remark |
| Cost of Goods Sold | Inventory Turnover Ratio | Inventory value is given |
| Net Income | Value of total asset is given | |
| Equity | Net income used to calculate | |
| Long Term Debt | LTD To Equity | Equity value used |
| Sales | Net Profit Margin | Net profit used to find sales |
| Interest Expense | Times Interest Earned | Earnings before interest and tax used to calculate |
| Accounts Receivable | A/R Turnover | Sales figure already calculated |
| Net Plant and Equipment | Fixed Turnover | Sales figure used to find Average fixed assets and half of |
b)
Summary Introduction
To compute: Figures marked with ‘formula’ in the financial statements.
b)
Expert Solution
Explanation of Solution
Sequence of figures calculated and basis:
| Formula to Be Calculated | Remark |
| Gross Profit | Sales − Cost Of Goods Sold |
| Earnings Before Interest and Tax | Gross Profit − Depreciation − Selling and Administration Expenses − Lease Expenses |
| Earnings Before Tax | Earnings Before Interest And Tax − Interest |
| Tax | Charged at 40 % of Earnings Before Tax |
| Total Current Assets | Cash + Accounts Receivable + Inventory |
| Accumulated Depreciation | Balancing Figure |
| Short Term Notes Payable | Balancing Figure |
| Total Liabilities and Owner’s Equity | Total Assets |
Want to see more full solutions like this?
Subscribe now to access step-by-step solutions to millions of textbook problems written by subject matter experts!
Students have asked these similar questions
4. Assume that you will be up for a promotion next month and you'd like to impress your boss with your data analytic skills. The company you work for normally books the current month's bad debit for the same amount as the prior month's actual accounts receivable write-offs. Using general accounting knowledge, explain why this process is not the best method.
5. Briefly describe Benford's Law. Draw a graph that exemplifies data which conforms to Benford's Law (i.e., what it should look like). And, briefly describe how auditors could utilize Benford's Law while conducting testwork.
Using Excel, create a table that shows the relationship between the interestearned and the amount deposited, as shown. we will first create the dollar amount column and the interest row, as shown . Next we will type into cell B3 the formula = $A3*B$2. We can now use the Fill command to copy the formula in other cells, resulting in the table as shown. Note that the dollar sign before A3 means column A is to remain unchanged in the calculations when the formula is copied into other cells. Also note that the dollar sign before 2 means that row 2 is to remain unchanged in calculations when the Fill command is used.
Damon Davis was working on a spreadsheet for the Drano Plumbing Company.
He calculated that the net profit would be $50,000.
He totaled the columns on the Balance Sheet as follows: debit, $400,000; and credit, $300,000.
What was the most likely cause of this disparity?
If this was not the case, how should he go about determining the cause of the error?
Chapter 3 Solutions
EBK FINANCIAL ANALYSIS WITH MICROSOFT E
Knowledge Booster

Similar questions
- Krall Company recently had a computer malfunction and lost a portion of its accounting records. The company has reconstructed some of its financial performance measurements including components of the return on investment calculations.Required:Help Krall rebuild its information database by completing the following table: (Do not round your intermediate calculations. Round your final answers to 2 decimal places, (i.e. 0.1234 should be entered as 12.34%.).)arrow_forwardDamon Davis was creating the Drano Plumbing Company's spreadsheet. According to his estimates, the net revenue would be $50,000. Who knows what the most probable cause of this mismatch was, but his Total Balance Sheet Columns showed a deficit of $400,000 and a credit of $300,000, which he summed together and calculated as follows: Why shouldn't this be the case, and what should he do to locate the issue's root cause?arrow_forwardAfter a recent computer crash, the accountant salvaged the following Trial Balance which was saved before proofing for errors. While all the account titles and account balance amounts are correct, some of the balances are not listed in the proper order or Debit/Credit columns. After making the necessary corrections, what is the correct balancing totals for this Trial Balance? Los Rolano, DESIGNER Trial Balance November 30, 2017 Account Title Balance Debit CreditCash $ 7,410Accounts Receivable $1,300Office Supplies 500Prepaid Insurance 2,400Furniture 1,500Land…arrow_forward
- Click on the "Prepare Fin Sts" tab and enter your name in Cell C1. If Cell C1 is left blank, you will not be able to see your score. Each graded cell is highlighted in yellow. Select all account titles/labels using dropdowns. Enter formulas for all dollar amounts. The formula must only contain cell addresses. Each correct formula will begin with =, +, or -. The basic mathematical operators are +, -, * and / Addition: To add the values in cells A1 and B4, the formula is =A1+B4 Subtraction: To subtract the value in cell B4 from the value in cell A1, the formula is =A1-B4 Multiplication: To multiply the values in cells A1 and B4, the formula is =A1*B4 Division: To divide the value in cell A1 by the value in cell B4, the formula is =A1/B4 THIS FILE REQUIRES THE USE OF =SUM FOR ALL TOTALS AND SUBTOTALS The =SUM function adds all values…arrow_forwardClick the Chart sheet tab. This chart is based on the problem data and the two income statements. Answer the following questions about the chart: a. What is the title for the X-axis? b. What is the title for the Y-axis? c. What does data range A represent? d. What does data range B represent? e. Why do the two data ranges cross? f. What would be a good title for this chart? When the assignment is complete, close the file without saving it again. Worksheet. The VARCOST2 worksheet is capable of calculating variable and absorption income when unit sales are equal to or less than production. An equally common situation (that this worksheet cannot handle) is when beginning inventory is present and sales volume exceeds production volume. Revise the worksheet Data Section to include: Also, change actual production to 70,000. Revise the Answer Section to accommodate this new data. Assume that Anderjak uses the weighted-average costing method for inventory. Preview the printout to make sure that the worksheet will print neatly on one page, and then print the worksheet. Save the completed file as VARCOSTT. Check figure: Absorption income, 670,000. Chart. Using the VARCOST2 file, fix up the chart used in requirement 5 by adding appropriate titles and legends and formatting the X- and Y-axes. Enter your name somewhere on the chart. Save the file again as VARCOST2. Print the chart.arrow_forwardDamon Davis was concluding Drano Plumbing's paperwork. He predicted a $50,000 net profit. When he tallied up the columns on the Balance Sheet, he found that the debit column amounted to $400,000 and the credit column amounted to $300,000. What was the most likely source of the result discrepancy? If this was not the source of the problem, how might he continue to identify its origin?arrow_forward
- Pls show me how to calculate each one. and show me full detail explanations. Dont JUST give me the answers. I need formulas and explanation. Thats more important than the solutions. Please I really need help. I failed both of my tests on accounting. I just dont get it. It's so hard. List all the advertising, selling, expenses and what is the operating profit. I mainly need help with that. Below is a list of balances for Sandals Inc. for the year ending December 31, 2020. All balances are in thousands of dollars. Sandals Inc. follows IFRS. Assume a tax rate of 20%. Exclude the presentation of earnings per share for this question. Unlimited common shares are authorized and 2,700 have been issued and are currently outstanding.The notes payable is payable over 5 years and $4,000 will be paid by December 31, 2021. Account Title Balance Accounts Payable $9,800 Accounts Receivable $12,900 Accumulated Depreciation $1,200 Advertising Expense $1,200 Cash $19,900 Cash Dividends…arrow_forwardYou are assigned as the financial advisor of the would-be entrepreneur James Udderlie. Write a 100-wordreport of the possibilities of James getting a loan for hisnew business.Type your report below (you may attach tables /appendices / calculations as you see fit). Be mindful ofthe word limit. Do not send PDF document formatreport. You may like to consider some template toframe your answer e.g., 5 "C" (condition / collateral /capacity / character/ capital; 4 Ps (Price / Product /Promotion / Place); or SWOT (Strength / Weakness /Opportunity / Threat).arrow_forwardDuring the research process, if you are unsure whether or not you've found all the relevant literature, what should you do? A. Google it to see if there is anything else you've missed. B. Call your manager to verify that you've found it all. C. Use the search engine included in the Codification. D. Complain that it's too much work and call it a day.arrow_forward
- I am stuck on this adjusted trial balance sheet exercise. I am attaching images. I have populated all the fields that I can. I have missing entries due to the fact that I am brain dead when it comes to Title/Description. The last image shows the fields that are missing with yellow highlights. I have included all the setup information in the images as well.arrow_forwardI just finished entering entries into the journal ledger byway of Quickbooks. However, my Journal is off by $1.80, the Trial Balance is off by $.90, and the Balance Sheet is off by $.90. The Profit & Loss Statement is correct. I don't know where to start looking for the error.arrow_forwardPlease watch the following video, which introduces you to the concepts of horizontal and vertical analysis. The first 6 minutes defines these concepts, after which the professor in the video discusses an example of their usefulness for assessing theft and locating unrecorded revenues. Accounting: Horizontal & Vertical Analysis (13:13 min) Once you have watched the video, write a paragraph that includes the following components: Define horizontal and vertical analysis in your own words. Explain why horizontal and vertical analysis can be valuable to a company. Describe how it might apply to either your own employer or another business you know of.arrow_forward
arrow_back_ios
SEE MORE QUESTIONS
arrow_forward_ios
Recommended textbooks for you
 Excel Applications for Accounting PrinciplesAccountingISBN:9781111581565Author:Gaylord N. SmithPublisher:Cengage Learning
Excel Applications for Accounting Principles
Accounting
ISBN:9781111581565
Author:Gaylord N. Smith
Publisher:Cengage Learning