
Basic Business Statistics, Student Value Edition
14th Edition
ISBN: 9780134685113
Author: Mark L. Berenson, David M. Levine, David F. Stephan, Kathryn Szabat
Publisher: PEARSON
expand_more
expand_more
format_list_bulleted
Concept explainers
Videos
Textbook Question
Chapter 3, Problem 21PS
The file Indices contains the total rate of return percentage for the Dow Jones Industrial Average (DJIA), the Standard & Poor's 500 (S&P 500), and the technology-heavy NASDAQ Composite (NASDAQ) from 2013 through 2016. These data are:
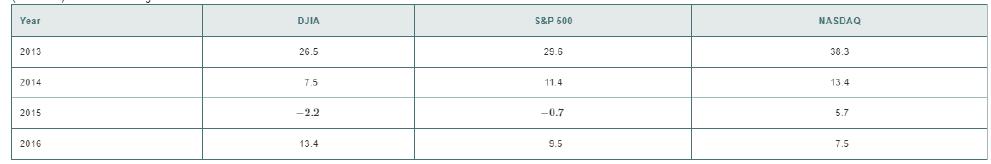
a. Compute the geometric mean rate of return per year for the DJIA, S & P 500, and NASDAQ from 2013 through 2016.
b. What conclusion can you reach concerning the geometric mean rates of return per year of the three market indices?
c. Compare the result of (b) to those of problem 3.22(b).
Expert Solution & Answer
Want to see the full answer?
Check out a sample textbook solution
Students have asked these similar questions
Bartman Industries' and Reynolds Inc.'s stock prices and dividends, along with the Winslow 5000 Index, are shown here for the period 2015-2020. The Winslow 5000 data are adjusted to include dividends.
Data as given in the problem are shown below:
Bartman Industries
Reynolds Inc.
Winslow 5000
Year
Stock Price
Dividend
Holding period return
Stock Price
Dividend
Holding period return
Includes Divs.
Holding period return
2020
$17.25
$1.15
24.75%
$48.75
$3.00
-1.05%
11,663.98
32.76%
2019
14.75
1.06
-4.18%
52.30
2.90
13.23%
8,785.70
1.22%
2018
16.50
1.00
62.79%
48.75
2.75
-10.04%
8,679.98
34.91%
2017
10.75
0.95
2.90%
57.25
2.50
-0.42%
6,434.03
14.85%
2016
11.37
0.90
61.02%
60.00
2.25
11.66%
5,602.28
19.05%
2015
7.62
55.75
4,705.97
Assume the risk-free rate on long-term Treasury bonds is 6.04%. Assume also that the average annual return on the Winslow 5000 is 11% as the expected return on the market. Use the SML equation (i.e., CAPM) to…
Official unemployment rates for the U.S. population are reportedon a monthly basis by the Bureau of Labor Statistics.For the period October, 2011, through January, 2012, theofficial unemployment rates were 8.9% (Oct.), 8.7% (Nov.),8.5% (Dec.), and 8.3% (Jan.). (Source: U.S. Bureau of LaborStatistics, www.bls.gov.) If the unemployment rateswere to continue to decrease following a linear model,(a) predict the unemployment rate on January, 2013.(b) predict when the United States would reach a zero unemploymentrate.
A stock has monthly returns of 9%, 22%, 15%, and 28%. What is the stock's geometric average
return?
Chapter 3 Solutions
Basic Business Statistics, Student Value Edition
Ch. 3 - The following set of data is from sample of n=5:...Ch. 3 - The following set of data is from sample of n=6:...Ch. 3 - The following set of data is from sample of n=7:...Ch. 3 - The following set of data is from sample of n=5:...Ch. 3 - Suppose that the rate of return for a particular...Ch. 3 - Suppose that the rate of return for a particular...Ch. 3 - Wired a magazine that delivers a glimpse into the...Ch. 3 - The operation manager of a plant that manufactures...Ch. 3 - Accounting to the U.S Census Bureau (census....Ch. 3 - The files Mobile Speed contain the overall...
Ch. 3 - The file Airport Rating contains the rating of...Ch. 3 - The annual NFL Super Bowl is the most widely...Ch. 3 - The AccountingPartners contains the number of...Ch. 3 - The file MobileCommerce contain the following...Ch. 3 - Prob. 15PSCh. 3 - Prob. 16PSCh. 3 - A bank branch located in a commercial district of...Ch. 3 - Suppose that another bank branch, location in a...Ch. 3 - Prob. 19PSCh. 3 - Prob. 20PSCh. 3 - The file Indices contains the total rate of return...Ch. 3 - In 2013 through 2016, the value of precious metals...Ch. 3 - Using the three-year return percentage variable in...Ch. 3 - Prob. 24PSCh. 3 - Using the three-year return percentage variable in...Ch. 3 - Prob. 26PSCh. 3 - The following is a set of data from a sample of...Ch. 3 - The following is a set of data from a sample of...Ch. 3 - The following is a set of data from a sample of...Ch. 3 - The following is a set of data from a sample of...Ch. 3 - Prob. 31PSCh. 3 - The file MobileCommerce contains the following...Ch. 3 - Prob. 33PSCh. 3 - Prob. 34PSCh. 3 - The file CD Rate contains the yields for one-year...Ch. 3 - A bark branch located in a commercial district of...Ch. 3 - The following is a set of data for a population...Ch. 3 - The following is a set of data for a population...Ch. 3 - The file McDonaldsStores contains the number of...Ch. 3 - Consider a population of 1.024 mutual funds that...Ch. 3 - Prob. 41PSCh. 3 - Prob. 42PSCh. 3 - Thirty companies comprise the DJIA Just how big...Ch. 3 - The following is a set of data from sample of n=11...Ch. 3 - A study of 267 college students investigated the...Ch. 3 - The file Cereals lists the calories and sugar. in...Ch. 3 - Movie companies need to predict the gross receipts...Ch. 3 - The fie Mobile Speed contains the overall download...Ch. 3 - A Pew Research Center survey found a noticeable...Ch. 3 - What are the properties of a set of numerical...Ch. 3 - What is meant by the property of central tendency?Ch. 3 - What are the differences among the mean, median,...Ch. 3 - How do you interpret the first quartile, median,...Ch. 3 - What is meant by the property of variation?Ch. 3 - What does the Z score measure?Ch. 3 - What are the differences among the various...Ch. 3 - How does the empirical rule help explain the ways...Ch. 3 - How do the empirical rule and the Chebyshev rule...Ch. 3 - What is meant by the property of shape?Ch. 3 - What is the difference between skewness and...Ch. 3 - What is the difference between the arithmetic mean...Ch. 3 - How do the covariance and the coefficient of...Ch. 3 - The American Society for Quality (ASQ) conducted a...Ch. 3 - Prob. 64PSCh. 3 - One of the 111801 measures of the quality of...Ch. 3 - Call centers today play an important role in...Ch. 3 - The financial services call center also monitors...Ch. 3 - Prob. 68PSCh. 3 - A quality characteristic of interest for a...Ch. 3 - The manufacturer of Boston and Vermont asphalt...Ch. 3 - Prob. 71PSCh. 3 - The file Protein contains calories. protein. and...Ch. 3 - What was the mean price of a room at two-star,...Ch. 3 - The file Property Taxes contains the property...Ch. 3 - Have you wondered how Internet connection speed...Ch. 3 - Prob. 76PSCh. 3 - Prob. 77PSCh. 3 - Prob. 78PSCh. 3 - You are planning to study for your statistics...Ch. 3 - The file DomesticBeer contains the percentage...
Knowledge Booster


Learn more about
Need a deep-dive on the concept behind this application? Look no further. Learn more about this topic, statistics and related others by exploring similar questions and additional content below.Similar questions
- Ten annual returns are listed in the following table: (Click on the following icon o in order to copy its contents into a spreadsheet.) - 19.3% 16.9% 18.5% - 49.9% 43.1% 1.9% - 16.9% 46.3% 45.3% - 3.2% a. What is the arithmetic average return over the 10-year period? b. What is the geometric average return over the 10-year period? c. If you invested $100 at the beginning, how much would you have at the end?arrow_forwardFind out the next month after april income by using the forecasting method of the moving average methodarrow_forwardThe following data were taken from Miller Company's balance sheet: Dec. 31, Year 2 Dec. 31, Year 1 Total liabilities $150,000 $105,000 Total stockholders' equity 75,000 60,000 a. Compute the ratio of liabilities to stockholders' equity. Round your answers to one decimal place. Liabilities toStockholders' Equity 12/31/Year 2: fill in the blank 1 12/31/Year 1: fill in the blank 2 b. Has the creditors' risk increased or decreased from December 31, Year 1, to December 31, Year 2?arrow_forward
Recommended textbooks for you
 MATLAB: An Introduction with ApplicationsStatisticsISBN:9781119256830Author:Amos GilatPublisher:John Wiley & Sons Inc
 Probability and Statistics for Engineering and th...StatisticsISBN:9781305251809Author:Jay L. DevorePublisher:Cengage Learning
 Statistics for The Behavioral Sciences (MindTap C...StatisticsISBN:9781305504912Author:Frederick J Gravetter, Larry B. WallnauPublisher:Cengage Learning
 Elementary Statistics: Picturing the World (7th E...StatisticsISBN:9780134683416Author:Ron Larson, Betsy FarberPublisher:PEARSON
 The Basic Practice of StatisticsStatisticsISBN:9781319042578Author:David S. Moore, William I. Notz, Michael A. FlignerPublisher:W. H. Freeman
 Introduction to the Practice of StatisticsStatisticsISBN:9781319013387Author:David S. Moore, George P. McCabe, Bruce A. CraigPublisher:W. H. Freeman
MATLAB: An Introduction with Applications
Statistics
ISBN:9781119256830
Author:Amos Gilat
Publisher:John Wiley & Sons Inc
Probability and Statistics for Engineering and th...
Statistics
ISBN:9781305251809
Author:Jay L. Devore
Publisher:Cengage Learning
Statistics for The Behavioral Sciences (MindTap C...
Statistics
ISBN:9781305504912
Author:Frederick J Gravetter, Larry B. Wallnau
Publisher:Cengage Learning
Elementary Statistics: Picturing the World (7th E...
Statistics
ISBN:9780134683416
Author:Ron Larson, Betsy Farber
Publisher:PEARSON
The Basic Practice of Statistics
Statistics
ISBN:9781319042578
Author:David S. Moore, William I. Notz, Michael A. Fligner
Publisher:W. H. Freeman
Introduction to the Practice of Statistics
Statistics
ISBN:9781319013387
Author:David S. Moore, George P. McCabe, Bruce A. Craig
Publisher:W. H. Freeman
Statistics 4.1 Point Estimators; Author: Dr. Jack L. Jackson II;https://www.youtube.com/watch?v=2MrI0J8XCEE;License: Standard YouTube License, CC-BY
Statistics 101: Point Estimators; Author: Brandon Foltz;https://www.youtube.com/watch?v=4v41z3HwLaM;License: Standard YouTube License, CC-BY
Central limit theorem; Author: 365 Data Science;https://www.youtube.com/watch?v=b5xQmk9veZ4;License: Standard YouTube License, CC-BY
Point Estimate Definition & Example; Author: Prof. Essa;https://www.youtube.com/watch?v=OTVwtvQmSn0;License: Standard Youtube License
Point Estimation; Author: Vamsidhar Ambatipudi;https://www.youtube.com/watch?v=flqhlM2bZWc;License: Standard Youtube License