
Videos
(a)
The
Answer to Problem 1RWYL
It required scatter plot is shown in figure
Explanation of Solution
Given information:
The data is given by,
| X | Y |
| 70 | 88 |
| 58 | 52 |
| 85 | 84 |
| 82 | 74 |
| 70 | 80 |
| 40 | 36 |
| 85 | 48 |
| 85 | 96 |
Concept used:
A scatter plot (also called a scatter, scatter graph, scatter chart, scatter gram, or scatter diagram) is a type of plot or mathematical diagram using Cartesian coordinates to display values for typically two variables for a set of data.
Consider the given data.
| X | Y |
| 70 | 88 |
| 58 | 52 |
| 85 | 84 |
| 82 | 74 |
| 70 | 80 |
| 40 | 36 |
| 85 | 48 |
| 85 | 96 |
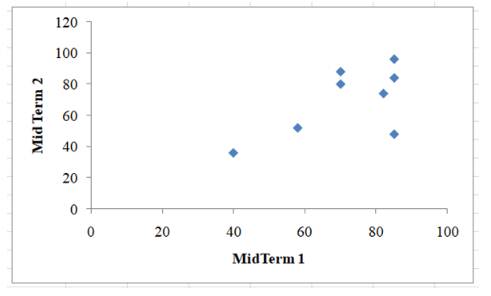
The scatter plot is shown in figure

Figure
Therefore, the required scatter plot is shown in figure
(b)
The pattern of the scatter plot of the given data.
Answer to Problem 1RWYL
The relationship between the variables is positive linear and strong.
Explanation of Solution
Given information:
The data is given by,
| X | Y |
| 70 | 88 |
| 58 | 52 |
| 85 | 84 |
| 82 | 74 |
| 70 | 80 |
| 40 | 36 |
| 85 | 48 |
| 85 | 96 |
Concept used:
A scatter plot (also called a scatter, scatter graph, scatter chart, scatter gram, or scatter diagram) is a type of plot or mathematical diagram using Cartesian coordinates to display values for typically two variables for a set of data.
Consider the given data.
| X | Y |
| 70 | 88 |
| 58 | 52 |
| 85 | 84 |
| 82 | 74 |
| 70 | 80 |
| 40 | 36 |
| 85 | 48 |
| 85 | 96 |
The scatter plot is shown in figure
Figure
Scatter plot shows that relationship between the variables midterm
Therefore, the relationship between the variables is positive linear and strong.
Want to see more full solutions like this?
Chapter 3 Solutions
Introduction To Probability And Statistics


 Big Ideas Math A Bridge To Success Algebra 1: Stu...AlgebraISBN:9781680331141Author:HOUGHTON MIFFLIN HARCOURTPublisher:Houghton Mifflin Harcourt
 Glencoe Algebra 1, Student Edition, 9780079039897...AlgebraISBN:9780079039897Author:CarterPublisher:McGraw Hill