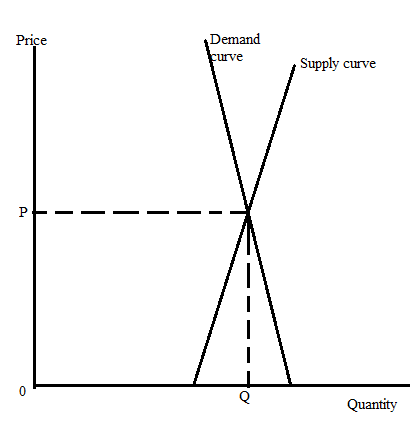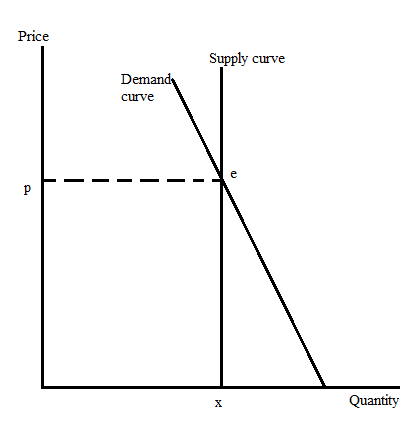
The demand and supply curve for human kidneys.
Explanation of Solution
If the market in kidneys were legal, then the demand and supply curves look like the ones shown in the diagram.
The demand and supply for the kidney are relatively inelastic because this is the organ that a person needs in emergency situations despite its high cost. The demand for human organs is inelastic in nature.
If the market of kidneys is legal, then the person who needs the kidney would get them despite fluctuating prices.
The demand and supply mechanism keeps the market for the kidney in equilibrium.

If the law that prohibits the sale of kidneys exists in a market, the demand for kidneys will still remain the same. But since the supply is restricted, now a person can only donate the organ instead of selling them.
Suppose in the presence of a law that prohibits the selling of organs, X quantity of kidney is donated by peoples.
Since selling is prohibited, the supply curve is a vertical line parallel to the y-axis because supply is limited and cannot increase according to the market demand.
This explanation is shown in the graph, where the x-axis represents the quantity of the kidney and the y-axis represents the price for the kidney.

The ban or prohibition on the sale of human organs promotes barter exchange, other illegal activities and the black market in organ transfers.
Want to see more full solutions like this?
- I need help with the one that says Model Legibility. Would this be the zero Conditional mean?arrow_forwardConsider a standard Hotelling model of competition with quadratic transportation costs. The consumers are located uniformly along a segment of unit length. There are two firms, A and B, located at the opposite ends of the segment. Each firm has constant marginal costs 2. Each consumer buys at most one unit of product and gets utility 20. Each consumer incurs travel cost of 4 times the square of traveled distance. Find equilibrium price and profit of firm A when firms set a unform price for the entire Hotelling segment. Suppose now that firms can price discriminate between consumers located in the interval 悯 (interval 1) and those located in the interval 瞓 (interval 2). Find equilibrium prices of firm A and B on the interval 1. Answer: equilibrium uniform price of firm A = profit of firm A under uniform pricing = equilibrium price of firm A on interval 1 = equilibrium price of firm B on interval 1 = ✓arrow_forwardDon't give AI generated solution Give all answers Please send me the graph for part farrow_forward
- You are planning to open a new Italian restaurant in your hometown where there are three other Italian restaurants. You plan to distinguish your restaurant from your competitors by offering northern Italian cuisine and using locally grown organic produce. What is likely to happen in the restaurant market in your hometown after you open? Part 2 A. While the demand curves facing your competitors becomes more elastic, your demand curve will be inelastic. B. The demand curve facing each restaurant owner shifts to the right. C. The demand curve facing each restaurant owner becomes more elastic. D. Your competitors are likely to change their menus to make their products more similar to yours.arrow_forwardConsider the following actions undertaken by a firm: a. charging a higher price for products of higher quality b. charging different prices to different consumers for the same product when the variation cannot be explained by cost differences c. charging different prices for products of different qualities d. charging a lower price to match a competitor's price Which of the above will be considered price discrimination? A. a, b, c, and d B. b and d only C. a, b, and d only D. b onlyarrow_forwardIf there were 10 firms in this market, the short-run equilibrium price of ruthenium would be $ Therefore, in the long run, firms would would Because you know that competitive firms earn S per pound. At that price, firms in this industry the ruthenium market. economic profit in the long run, you know the long-run equilibrium price must be per pound. From the graph, you can see that this means there will be firms operating in the ruthenium industry in long-run equilibrium. True or False: Assuming implicit costs are positive, each of the firms operating in this industry in the long run earns positive accounting profit. O True O Falsearrow_forward
- The U.S. Census Bureau conducts annual surveys to obtain information on the percentage of the voting-age population that is registered to vote. Suppose that 679 employed persons and 690 unemployed persons are independently and randomly selected, and that 429 of the employed persons and 369 of the unemployed persons have registered to vote. Can we conclude that the percentage of employed workers (P1), who have registered to vote, exceeds the percentage of unemployed workers (P2), who have registered to vote? Use a significance level of α = 0.05 for the test. Step 4 of 6: Compute the value of the test statistic. Round your answer to two decimal places.arrow_forwardI need help with #12 pleasearrow_forwardThe U.S. Census Bureau conducts annual surveys to obtain information on the percentage of the voting-age population that is registered to vote. Suppose that 679 employed persons and 690 unemployed persons are independently and randomly selected, and that 429 of the employed persons and 369 of the unemployed persons have registered to vote. Can we conclude that the percentage of employed workers (P1), who have registered to vote, exceeds the percentage of unemployed workers (P2), who have registered to vote? Use a significance level of α = 0.05 for the test. Step 3 of 6: Compute the weighted estimate of p, p. Round your answer to three decimal places.arrow_forward
- On Saturday nights, the population share of viewers watching various broadcast TV networks are known to be: ABC 29% CBS 28% NBC 25% Other 18% A sample of 300 viewers on Sunday night showed the following numbers watching each network: ABC 95 CBS 70 NBC 89 Other 46 46arrow_forwardIf people's inflation expectations rise, the short-run Phillips curve will: a) Shift left b) Shift right c) experience a downwards movement along the existing curve d) experience a upwards movement along the existing curvearrow_forwardAccording to the equation in the textbook, if the natural rate of unemployment is 5%,actual inflation is 4%, expected inflation is 2%, and α = 1, what would be theunemployment rate?Unemployment rate = Natural rate of unemployment – α(Actual inflation – Expectedinflation)arrow_forward
 Exploring EconomicsEconomicsISBN:9781544336329Author:Robert L. SextonPublisher:SAGE Publications, Inc
 Microeconomics: Private and Public Choice (MindTa...EconomicsISBN:9781305506893Author:James D. Gwartney, Richard L. Stroup, Russell S. Sobel, David A. MacphersonPublisher:Cengage Learning
 Economics: Private and Public Choice (MindTap Cou...EconomicsISBN:9781305506725Author:James D. Gwartney, Richard L. Stroup, Russell S. Sobel, David A. MacphersonPublisher:Cengage Learning


