
Videos
FINANCIAL STATEMENTS, CASH FLOW, AND TAXES Laiho Industries’s 2017 and 2018 balance sheets (in thousands of dollars) are shown.
| 2018 | 2017 | |
| Cash | $ 102,850 | $ 89,725 |
| Accounts receivable | 103,365 | 85,527 |
| Inventories | 38,444 | 34,982 |
| Total current assets | $ 244,659 | $ 210,234 |
| Net fixed assets | 67,165 | 42,436 |
| Total assets | $ 311,824 | $ 252,670 |
| Accounts payable | $ 30,761 | $ 23,109 |
| Accruals | 30,477 | 22,656 |
| Notes payable | 16,717 | 14,217 |
| Total current liabilities | $ 77,955 | $ 59,982 |
| Long-term debt | 76,264 | 63,914 |
| Total liabilities | $ 154,219 | $ 123,896 |
| Common stock | 100,000 | 90,000 |
| 57,605 | 38,774 | |
| Total common equity | $ 157,605 | $ 128,774 |
| Total liabilities and equity | $ 311,824 | $ 252,670 |
- a. Sales for 2018 were $ 455,150,000, and EBITDA was 15% of sales Furthermore,
depreciation and amortization were 11%. of net fixed assets, interest was $ 8,575,000, the corporate tax rate was 40%, and Laiho pays 40% of its net income as dividends Given this information. construct the firm’s 2018 income statement. - b. Construct the statement of stockholders’ equity for the year ending December 31, 2018, and the 2018 statement of cash flows.
- c. Calculate 2017 and 2018 net operating working capital (NOWC) and 2018
free cash flow (FCF). Assume the firm has no excess cash. - d. If Laiho increased its dividend payout ratio, what effect would this have on corporate taxes paid’ What effect would this have on taxis, paid by the company’s shareholders?
- e. Assume that the firm’s after-tax cost of capital is 10 5%. What is the firm’s 2018 EVA?
- f. Assume that the firm’s stock price is S22 per share and that at year-end 2018 the firm has 10 million shares outstanding. What is the firm’s MVA at year-end 2018?
a.
To prepare: The income statement of company L for 2014.
Financial Statements:
It refer to the statements, which are prepared by the firm at the closure of the accounting period in particular formats and are prescribed in the accounting to show its financial position.
Income Statement:
A part of financial statements that list the income and expenses of the business for an accounting year is called the income statement. It is prepared at the closure of the accounting period to know the profitability of the business.
Explanation of Solution
Given information:
Sales is $455,150,000 for the year 2018.
EBITDA is 15% on sales.
11% of depreciation and amortization on net fixed asset.
Interest is $8,575,000.
40% tax.
40% of the divided on net income.
Calculation on income statement using the spreadsheet is as follows:
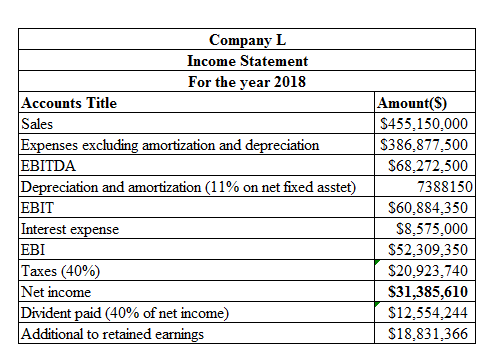
Table (1)
Therefore, Company L has a net income of $31,385,610.
b.
To prepare: The statement of stockholders’ equity of Company L for 2018.
Statement of stockholders’ equity:
The statement of stockholders’ equity reports the opening and closing balance of stockholder’s equity with the changes incurred during the accounting period.
Statement of cash flow:
The statement of cash flow is a part of fiscal statements those are comprised in the yearly report of a company. It reports the cash generated or used by the business in a specified period.
Explanation of Solution
The calculation of statement of stockholders’ equity using the spreadsheet for the year 2018 is as follows:
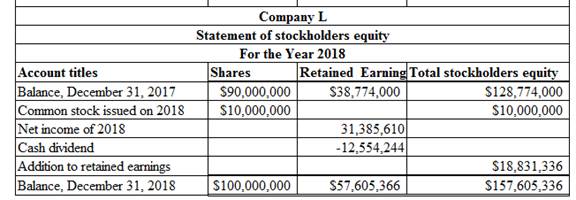
Table (2)
The calculation of statement of cash flow using the spreadsheet is as follows:
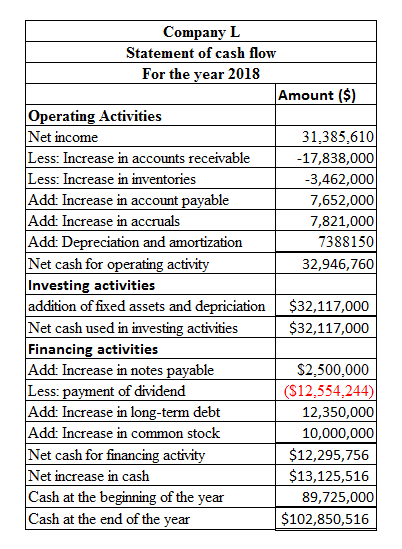
Table (3)
c.
To compute: The net operating working capital for 2017 and 2018, and the free cash flow for 2018.
The net operating working capital:
The current assets and current liabilities of active business operations are known as the operating current assets and the operating current liabilities, respectively. The difference between these two is known as the net operating working capital.
Free Cash Flow:
The performance of a company’s operations is also evaluated by its cash generation abilities. The term used to depict and report that ability is known as the free cash flow. Capital expenditures are deducted from operating cash flow to compute the free cash flow.
Explanation of Solution
The calculation of net operating working capital is as follows:
Given information:
Current assets in 2017 are $210,234,000.
Current liabilities in 2017 are $59,982,000.
Current assets in 2018 are $244,659,000
Current liabilities in 2018 are $77,955,000.
For the year 2017,
The formula to compute the net operating current assets is as follows:
Compute the net operating current assets:
Hence, the net operating current asset is $210,234,000.
For the year 2017,
The formula to compute the net operating current liabilities is as follows:
Compute the net operating current liabilities:
Hence, the net operating current liabilities is $45,765,000.
For the year 2018,
The formula to compute the net operating current assets is as follows:
Compute the net operating current assets:
Hence, the net operating current asset is $244,659,000.
For the year 2018,
The formula to compute the net operating current liabilities is as follows:
Compute the net operating current liabilities:
Hence, the net operating current liabilities is $61,238,000.
For 2017,
The formula to compute the net operating working capital is as follows:
Substitute $210,234 for the net operating current assets and $45,765,000 for the net operating current liabilities.
Hence, the net operating working capital for the year 2017 is $164,469,000.
For 2018,
The formula to compute the net operating working capital is as follows:
Substitute $244,659 for current assets and $77,955 for the current liabilities.
Hence, the net operating working capital for the year 2018 is $183,421,000.
Calculation of Free cash flow:
Given information:
EBIT is $60,884,358 (refer part a).
The tax rate is 40%.
Depreciation is $7,388,150 (refer part a).
Capital expenditure is $32,117,000 (refer part b).
Increase in the net operating working capital is $18,952,000
The formula to compute the free cash flow is as follows:
Substitute $60,884 for EBIT, 40% for tax rate, $7,388 for depreciation, $32,117 for capital expenditure and $18,952,000.
Hence, the free cash flow for the year 2018 is -$7,150,235.2.
d.
To analyze: The effect of increased dividend payment on company’s tax liability and stockholders’ liability.
Dividend Payout Ratio:
The ratio that reflects the dividends paid as the proportion of net income earned by a company during a specified time period is called the dividend payout ratio.
Answer to Problem 19SP
There will be no change in the taxes paid by the company but the stockholders’ tax liability will increase with the increase in the dividend payout.
Explanation of Solution
- The dividend payment is calculated after the tax is calculated. Therefore, there will be no change in the tax amount if the dividend payment is changed.
- The dividend is an income for the stockholders and taxable for them. Therefore their tax liability will increase if the dividend payout is increased.
Therefore, the increased dividend payment will have no change in the company’s tax liability but it will increase the stockholders’ tax liability.
e.
To compute: The economic value added (EVA) for 2018.
Explanation of Solution
Given information:
EBIT is 60,884,350.
The capital invested is $250,586,000
The cost of capital is 10.5%.
The formula to compute EVA is as follows:
Substitute $31,386 for the earnings after tax, $157,605 for the capital invested, and 10.5% for the cost of capital.
Hence, the EVA for the year 2018 is $10,219,080.
f.
To compute: The market value added (MVA) for 2018.
Explanation of Solution
Given information:
The market price of a share is $22.
Outstanding shares are 10 million.
Common equity is $157,605,000.
The formula to compute MVA is as follows:
Substitute $22 for the market price of the share, $157,605 for the capital invested, and 10,000,000 for the number of shares.
Hence, the MVA for the year 2018 is $62,395,000.
Want to see more full solutions like this?
Chapter 3 Solutions
Mindtap Finance, 1 Term (6 Months) Printed Access Card For Brigham/houston's Fundamentals Of Financial Management, 15th


- Below are Laiho Industries’ 2017 and 2018 balance sheet items: 2018 2017 Cash $ 102,850.00 $ 89,725.00 Accounts Receivable $ 103,365.00 $ 85,527.00 Long-Term Debt $ 76,264.00 $ 63,914.00 Accounts Payable $ 30,761.00 $ 23,109.00 Common Stock (total value) $ 100,000.00 $ 90,000.00 Notes Payable $ 16,717.00 $ 14,217.00 Net Fixed Assets $ 67,165.00 $ 42,436.00 Accruals $ 30,477.00 $ 22,656.00 Inventories $ 38,444.00 $ 34,982.00 Retained Earnings $ 57,605.00 $ 38,774.00 Sales for 2018 were $455,150, and EBITDA was 15% of sales. Furthermore, depreciation and amortization were 11% of net fixed assets, interest was $8,575, the corporate tax rate was 40%, and Laiho pays 40% of its net income as dividends. Given this information, construct the firm’s 2018…arrow_forwardFinancial statements, cash flow and taxes The 2018 and 2019 year-end balance sheets of Kairos Industries are shown below: 2019 2018 Cash $102,950 $89,825 Accounts receivable 103,465 85,627 Inventories 38, 544 35,082 Total current assets 244, 959 210, 534 Property, plant and equipment 67,265 42,536 Total assets 312,224 253,070 Accounts payable 30,861 23,209 Accruals 30,577 22,756 Liabilities payable 16,817 14,317 Total current liabilities 78,255 60,282 Long-term liabilities 76,364 64,014 Total liabilities 154, 619 124,296 Common stock 100,000 90,100 Retained earnings 57,605 38,874 Total stockholders' equity 157,605 128,974 Total liabilities plus stockholders' equity $312,224 $253,270 In 2019, Kairos Industries achieved sales of $330 million and EBITDA of 17% of…arrow_forwardLozano Chip Company: Balance Sheet as of December 31, 2019 (Thousands of Dollars) Cash Receivables Inventories Total current assets Net fixed assets $ 210,000 1,575,000 1,115,000 $2,900,000 1,315,000 Sales/Fixed assets Sales/Total assets $4,215,000 Accounts payable Notes payable Other current liabilities Total current liabilities Long-term debt Common equity Total liabilities and equity Total assets Lozano Chip Company: Income Statement for Year Ended December 31, 2019 (Thousands of Dollars) Sales Cost of goods sold Selling, general, and administrative expenses Earnings before interest and taxes (EBIT) Interest expense Earnings before taxes (EBT) Federal and state income taxes (25%) Net income Net income/Sales Net income/Total assets Net income/Common equity Total debt/Total assets Total liabilities/Total assets a. Calculate the indicated ratios for Lozano. Do not round intermediate calculations. Round your answers to two decimal places. Ratio Lozano Industry Average Current…arrow_forward
- Selected information from the comparative financial statements of AppleVerse Company for the year ended December 31 appears below: 2018 2017 Php Php Accounts receivable (net) 175,000 200,000 Inventory 130,000 150,000 Total assets 1,100,000 800,000 Current liabilities 140,000 110,000 Long-term debt 410,000 300,000 Net credit sales 800,000 700,000 Cost of goods sold 600,000 530.000 Interest expense 40.000 25,000 Income tax expense 60.000 29,000 Net income 150.000 85,000 Net cash provided by operating 220,000 135,000 activities Compute for the Receivables Turnover for 2018. O 2.13 O 4.27 O 5.95 O 3.23arrow_forwardThe following information has been extracted from the financial statements and notes of CASAN Ltd. 2019 2018 Cash and Cash Equivalents 59,100 47,700 Account Receivable(net) 137,800 129,800 Account Payable 45,750 39,950 Revenue 610,000 625,000 Cost of Goods Sold 559,500 568,500 Profit 50,500 56,500 Inventory 223,700 189,300 Total assets 540,000 555,000 Current Liabilities 250,900 265,700 Total liabilities 300,000 330,000 Short-term investments 75,400 85,900 Based on the above information calculate the following ratios: 1) Return on assets for 2019. 2) Profit Margin ratio for 2019. 3) Debt to assets ratio for 2019. 4) Acid-test ratio for 2018. 5) Inventory Turnover ratio for 2019.arrow_forwardMaligalig Company Comparative Statement of Financial Position December 31 (in Thousand Dollars) 2017 2016 2015 ASSETS Current Assets Cash and Cash Equivalents 91,100 12,628 11,254 Short term Investments 193,230 12,000 12,000 Trade Receivables, net of $30,000 allowance 485,000 529,949 510,435 Note Receivable – related party 12,325 18,941 21,543 Other Receivables 80,532 Inventory 212,515 252,567 252,567 Prepaid Insurance 7,500 7,500 7,500 Total Current Assets 1,001,670 914,117 815,299 Non-Current Asset Property, Plant and Equipment 209,330 209,330 209,330 Less Accumulated Depreciation 87,260 75,332 64,034…arrow_forward
- The AHAI Company's balance sheet of December 31, 2018 is given below: Accounts payable Notes payable Accrued wages and taxes Long-term debt Common equity Total liabilities & equity Cash Accounts receivable Inventory Net fixed assets Total assets O a. $6 O b. $7 O c. $8 O d. $40 O e. $5 $10 25 40 95 $170 $20 25 15 30 80 $170 Sales during the past year were $1,000, and they are expected to increase to $2,000 during 2019. AHAI's fixed assets were used to 60% of capacity during 2018, but its current assets were at their proper levels. All assets except fixed assets increase at the same rate as sales, and fixed assets would also increase at the same rate if the current excess capacity did not exist. Assume that AHAI's profit margin will remain constant at 4.25 percent and that the company will continue to pay out 40 percent of its earnings as dividends. What amount of additional funds (AFN) will be needed during the next year assuming the company would use up the excess capacity before…arrow_forwardData for Nobell Inc. is as follows: Nobell Inc. Comparative Balance Sheet December 31, 2018 and 2017 2018 2017 Assets Current Assets: Cash $121,000 $100,000 Accounts Receivables, Net 117,000 125,000 Merchandise Inventory 70,000 85,000 Total Assets $308,000 $310,000 Liabilities Total Current Liabilities 63,500 50,000 Long-term Liabilities 100,000 100,000 Total Liabilities 163,500 150,000 Stockholders' Equity Retained Earnings…arrow_forwardExcel Activity: Financial Statements, Cash Flow, and Taxes Laiho Industries's 2020 and 2021 balance sheets (in thousands of dollars) are shown. Laiho Industries: Balance Sheets as of December 31 (thousands of dollars) 2021 2020 Cash $ 106,278 $ 91,660 Accounts receivable 103,347 85,164 Inventories 38,965 35,757 Total current assets $ 248,590 $ 212,581 Net fixed assets 67,963 42,749 Total assets $ 316,553 $ 255,330 Accounts payable $ 30,151 $ 22,600 Accruals 31,711 24,202 Notes payable 17,606 14,626 Total current liabilities $ 79,468 $ 61,428 Long-term debt 77,320 64,070 Total liabilities $ 156,788 $ 125,498 Common stock 100,500 88,000 Retained earnings 59,265 41,832 Total common equity $ 159,765 $ 129,832 Total liabilities and equity $ 316,553 $ 255,330 The data has been collected in the Microsoft Excel file below.…arrow_forward
- Suppose the following financial data were reported by 3M Company for 2021 and 2022 (dollars in millions). 3M Company Balance Sheets (partial) 2022 2021 Current assets Cash and cash equivalents $3,044 $1,887 Accounts receivable, net 3,100 3,040 Inventories 2,687 3,022 Other current assets 1.894 1,526 Total current assets $10,725 $9.475 Current liabilities $ 4,988 $5,893 (a) Calculate the current ratio and working capital for 3M for 2021 and 2022. (Round current ratio to 2 decimal places, eg 125:1) Current ratio 2021 2.15 :1 2022 1.60 :1 Working capital 2021 %24 5737 million 2022 %24 3582 millionarrow_forwardBirtle Corporation reports the following statement of financial position information for 2017 and 2018. BIRTLE CORPORATION2017 and 2018 Statement of Financial Position Assets Liabilities and Owners’ Equity 2017 2018 2017 2018 Current assets Current liabilities Cash $ 9,279 $ 11,173 Accounts payable $ 41,060 $ 43,805 Accounts receivable 23,683 25,760 Notes payable 16,157 16,843 Inventory 42,636 46,915 Total $ 75,598 $ 83,848 Total $ 57,217 $ 60,648 Long-term debt $ 40,000 $ 35,000 Fixed assets Owners’ equity Net plant and equipment $ 272,047 $ 297,967 Common stock and paid-in surplus $ 50,000 $ 50,000 Retained earnings 200,428 236,167 Total $ 250,428 $ 286,167 Total assets $ 347,645 $ 381,815 Total liabilities…arrow_forwardBirtle Corporation reports the following statement of financial position information for 2017 and 2018. BIRTLE CORPORATION2017 and 2018 Statement of Financial Position Assets Liabilities and Owners’ Equity 2017 2018 2017 2018 Current assets Current liabilities Cash $ 9,279 $ 11,173 Accounts payable $ 41,060 $ 43,805 Accounts receivable 23,683 25,760 Notes payable 16,157 16,843 Inventory 42,636 46,915 Total $ 75,598 $ 83,848 Total $ 57,217 $ 60,648 Long-term debt $ 40,000 $ 35,000 Fixed assets Owners’ equity Net plant and equipment $ 272,047 $ 297,967 Common stock and paid-in surplus $ 50,000 $ 50,000 Retained earnings 200,428 236,167 Total $ 250,428 $ 286,167 Total assets $ 347,645 $ 381,815 Total liabilities…arrow_forward
 Essentials Of InvestmentsFinanceISBN:9781260013924Author:Bodie, Zvi, Kane, Alex, MARCUS, Alan J.Publisher:Mcgraw-hill Education,

 Foundations Of FinanceFinanceISBN:9780134897264Author:KEOWN, Arthur J., Martin, John D., PETTY, J. WilliamPublisher:Pearson,
 Fundamentals of Financial Management (MindTap Cou...FinanceISBN:9781337395250Author:Eugene F. Brigham, Joel F. HoustonPublisher:Cengage Learning
 Corporate Finance (The Mcgraw-hill/Irwin Series i...FinanceISBN:9780077861759Author:Stephen A. Ross Franco Modigliani Professor of Financial Economics Professor, Randolph W Westerfield Robert R. Dockson Deans Chair in Bus. Admin., Jeffrey Jaffe, Bradford D Jordan ProfessorPublisher:McGraw-Hill Education