
Concept explainers
Videos
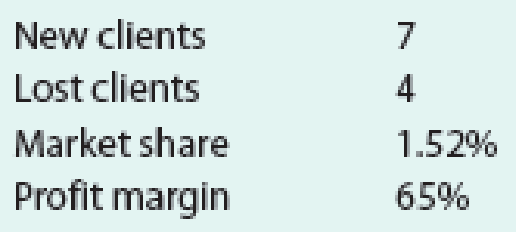
Blake & McKenzie Tax Services is a company serving 72 clients (as of the beginning of last month) that is working on reorganizing its balanced scorecard. Currently, the company has the following performance metrics: online client satisfaction rating, client growth percentage (the number of total clients at the beginning of the current month compared to the number of total clients at the beginning of the prior month), market share, and profit margin. The company tracks these metrics from month to month. The company’s target client growth percentage is 4% per month. Its target average online client satisfaction rating is 4.8 stars. Last month, the company noted the following data related to these metrics:
- a. Working together in teams, create strategic objectives that each of the company’s four performance metrics might represent.
- b. Determine whether the company achieved its client growth percentage target last month.
- c. Suppose that last month, the company received 55 five-star reviews, 10 four-star reviews, 3 three-star reviews, 1 two-star review, and 1 one-star review (some clients did not submit a review). Determine whether the company met its average online client satisfaction rating target.
- d. Come up with at least one strategic initiative for the strategic objective of any performance metric target that you know the company did not meet last month.

Trending nowThis is a popular solution!

Chapter 28 Solutions
Financial And Managerial Accounting


- The following revenue data were taken from the December 31, 2017, General Electric annual report (10-K): For each segment and each year, calculate intersegment sales (another name for transfer sales) as a percentage of total sales. Using Microsoft Excel or another spreadsheet application, create a clustered column graph to show the 2016 and 2017 percentages for each division. Comment on your observations of this data. How might a division sales manager use this data?arrow_forwardThe following table shows monthly revenue for six different web development companies. a. Use Excel to create sparklines for sales at each company. b. Which companies have generally decreasing revenues over the six months? Which company has exhibited the most consistent growth over the six months? Which companies have revenues that are both increasing and decreasing over the six months? c. Use Excel to create a heat map for the revenue of the six companies. Do you find the heat map or the sparklines to be better at communicating the trend of revenues over the six months for each company? Why?arrow_forwardFinancial information for BDS Enterprises for the year-ended December 31, 20xx, was gathered from an accounting intern, who has asked for your guidance on how to prepare an income statement format that will be distributed to management. Subtotals and totals are included in the information, but you will need to calculate the values. A. In the correct format, prepare the income statement using the following information: B. Calculate the profit margin, return on investment, and residual income. Assume an investment base of $100,000 and 6% cost of capital. C. Prepare a short response to accompany the income statement that explains why uncontrollable costs are included in the income statement.arrow_forward
- 72 Inc. has developed a balanced scorecard with the following performance metrics: Total sales Employee turnover Market share Number of shipping errors Median training hours per employee Number of new customers Relative to the metric customer satisfaction ratings, which of these performance metrics are leading indicators and which are lagging indicators?arrow_forwardThe following revenue data were taken from the December 31, 2017, Coca-Cola annual report (10-K): For each segment and each year, calculate intersegment sales (another name for transfer sales) as a percentage of total sales, Using Microsoft Excel or another spreadsheet application, create a clustered column graph to show the 2016 and 2017 percentages for each division. Comment on your observations of this data. How might a division sales manager use this data?arrow_forwardEvaluate the two departments for Moxie Products. Compare the years performance of the two departments in terms of ROI and RI. Which department has created the most wealth for Moxie shareholders in the past year?arrow_forward
- Ross Company implemented a quality improvement program and tracked the following for the five years: By cost category as a percentage of sales for the same period of time: Required: 1. Prepare a bar graph that reveals the trend in quality cost as a percentage of sales (time on the horizontal axis and percentages on the vertical). Comment on the message of the graph. 2. Prepare a bar graph for each cost category as a percentage of sales. What does this graph tell you? 3. What if management would like to have the trend in relative distribution of quality costs? Express this as a bar graph and comment on its significance.arrow_forwardBruin Wholesale has gathered the following data on the number of shipments received and the cost of receiving reports for the first seven weeks of 2010. Number of Shipment Received Weekly Cost of Receiving Reports 50 $175 44 162 40 154 35 142 53 185 58 200 60 202 a. Using the high-low method, develop the equation for predicting weekly receiving report costs based on the number of shipments received. b. What is the predicted amount of receiving report costs for a week in which 72 shipments are received? c. What are the concerns you have regarding your prediction from part (b)?arrow_forwardThe following table shows monthly revenue for six different web development companies. a. Use Excel to create sparklines for sales at each company.b. Which companies have generally decreasing revenues over the six months? Whichcompany has exhibited the most consistent growth over the six months? Which companieshave revenues that are both increasing and decreasing over the six months?c. Use Excel to create a heat map for the revenue of the six companies. Do you find theheat map or the sparklines to be better at communicating the trend of revenues overthe six months for each company? Why?arrow_forward
- Create an appropriate graph to show the correlation between the total revenuegenerated by Tesco and the number of its stores over the last recorded fiveyears?arrow_forwardWhich of the following best describes trend analysis? A comparing a company's financial statements with that of other companies B expressing each financial statement amount as a percentage of a budgeted amount C expressing each year's financial statement amounts as a percentage of the base year amounts D calculating key ratios to evaluate performancearrow_forwardA marketing professor at Givens College is interested in the relationship between hours spent studying and total points earned in a course. Data collected on 156 students who took the course last semester are provided in the tile MktHrsPts. Develop a scatter chart for these data. What does the scatter chart indicate about the relationship between total points earned and hours spent studying? Develop an estimated regression equation showing how total points earned is related to hours spent studying. What is the estimated regression model? Test whether each of the regression parameters β0 and β1 is equal to zero at a 0.01 level of significance. What are the correct interpretations of the estimated regression parameters? Are these interpretations reasonable? How much of the variation in the sample values of total point earned does the model you estimated in part (b) explain? Mark Sweeney spent 95 hours studying. Use the regression model you estimated in part (b) to predict the total points Mark earned.arrow_forward
 Managerial AccountingAccountingISBN:9781337912020Author:Carl Warren, Ph.d. Cma William B. TaylerPublisher:South-Western College PubFinancial And Managerial AccountingAccountingISBN:9781337902663Author:WARREN, Carl S.Publisher:Cengage Learning,
 Excel Applications for Accounting PrinciplesAccountingISBN:9781111581565Author:Gaylord N. SmithPublisher:Cengage Learning
 Essentials of Business Analytics (MindTap Course ...StatisticsISBN:9781305627734Author:Jeffrey D. Camm, James J. Cochran, Michael J. Fry, Jeffrey W. Ohlmann, David R. AndersonPublisher:Cengage Learning
 Cornerstones of Cost Management (Cornerstones Ser...AccountingISBN:9781305970663Author:Don R. Hansen, Maryanne M. MowenPublisher:Cengage Learning
 Principles of Accounting Volume 2AccountingISBN:9781947172609Author:OpenStaxPublisher:OpenStax College