
The
Explanation of Solution
The Phillips curve is used by the economists to depict the short-run relation between the inflation rate and the
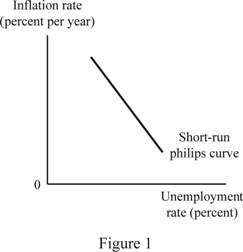
In Figure 1, the horizontal axis measures the unemployment rate and the vertical axis measures the inflation rate. It depicts the negative relationship between the unemployment and inflation rate. When the inflation rate is higher, the level of unemployment rate is lower and vice versa.
Concept introduction:
Phillips curve: Phillips curve shows the relationship and trade-off between the inflation rate and unemployment rate in an economy during the short-run period.
Want to see more full solutions like this?
Chapter 28 Solutions
Economics Plus MyLab Economics with Pearson eText (2-semester Access) -- Access Card Package (6th Edition) (The Pearson Series in Economics)

- Would you expect to see long-run data trace out a stable downward-sloping Phillips curve?arrow_forwardDo you think the Phillips curve is a useful tool for analyzing the economy today? Why or why not?arrow_forwardUsing the equation explain what causes shifts in the Phillips curve and what causes movement along the curve.arrow_forward
- How would a decrease in energy prices affect the Phillips curve?arrow_forwardGraphically derive short run Phillips curve with the help of aggregate demand and supply and demand.arrow_forwardDoes the Phillips curve have a positive or negative slope? Explain how this slope is derived. When will an increase in aggregate demand not result in lower unemployment rates in the short run?arrow_forward
- 49. What does the Phillips Curve show? Draw a hypothetical (short-run) Phillips Curve and a long run Phillips curve in the same graph.arrow_forwardWith the image attached, what does the Phillips Curve Represent.arrow_forwardWhat is the "Phillips Curve"? Why do inflation and unemployment tend to be inversely related?arrow_forward
- The Phillips curve represents the relationship between unemployment and inflation. You are required to think about the impact on the economy of movements along the curve. If the unemployment rate in the economy is steady at 4 percent per year, how does the short-run Phillips curve predict that the inflation rate will be changing, if at all? What will happen if the unemployment rate now rises to 7 percent per year? Assume there are no changes to inflation expectations. Provide an appropriate graph to support your discussion.arrow_forward1. Aggregate demand, aggregate supply, and the Phillips curve In the year 2027, aggregate demand and aggregate supply in the imaginary country of Aso-Kuju are represented by the curves AD2027 and AS on the following graph. The price level is currently 102. The graph also shows two potential outcomes for 2028. The first possible aggregate demand curve is given by the curve labeled ADA curve, resulting in the outcome given by point A. The second possible aggregate demand curve is given by the curve labeled ADB, resulting in the outcome given by point B. PRICE LEVEL 108 107 106 105 104 103 102 101 100 0 AD 2027 2 4 B AS ADB ADA 8 10 6 OUTPUT (Trillions of dollars) 12 14 16 (?) Suppose the unemployment rate is 7% under one of these two outcomes and 5% under the other. Based on the previous graph, you would expect outcome B▼ to be associated with the lower unemployment rate (5%). If aggregate demand is high in 2028, and the economy is at outcome B, the inflation rate between 2027 and 2028…arrow_forwardSuppose oil prices rise what happens to the short-run Phillips curve?arrow_forward


