
Videos
Perform the same computation for the Lorenz equations in Sec. 28.2, but use (a) Euler's method, (b) Heun's method (without iterating the corrector), (c) the fourth-order RK method, and (d) the MATLAB ode45 function. In all cases use single-precision variables and a step size of 0.1 and simulate from
(a)
To calculate: The solution of Lorentz equation
Answer to Problem 18P
Solution:
The solution of Lorentz equations by the Euler’s method with step size 0.1 gives unstable solution.
Explanation of Solution
Given Information:
Lorentz equations,
and Initial conditions are
Formula used:
Euler’s method for
Where, h is the step size.
Calculation:
Consider the equations,
The iteration formula for Euler’s method with step size
Use excel to find all the iteration with step size
Step 1: Name the column A as t and go to column A2 and put 0 then go to column A3 and write the formula as,
=A2+0.1
Then, Press enter and drag the column up to
Step 2: Now name the column B as x-Euler and go to column B2 and write 5 and then go to the column B3 and write the formula as,
=B2+0.1*(-10*B2+10*C2)
Step 3: Press enter and drag the column up to
Step 4: Now name the column C as y-Euler and go to column C2 and write 5 and then go to the column C3 and write the formula as,
=C2+0.1*(28*B2-C2-B2*D2)
Step 5: Press enter and drag the column up to
Step 6: Now name the column D as z-Euler and go to column D2 and write 5 and then go to the column D3 and write the formula as,
=D2+0.1*(-2.666667*D2+B2*C2)
Step 7: Press enter and drag the column up to
Thus, first few iterations are as shown below,
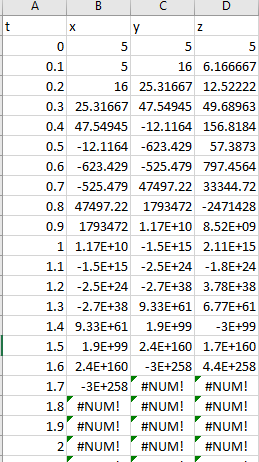
From the above result, it is observed that the solution of Lorentz equations by the Euler’s method with step size 0.1 the values are continuously decreasing. Hence, Euler method with step size 0.1 gives unstable solution for the Lorentz equations.
(b)
To calculate: The solution of Lorentz equation
Answer to Problem 18P
Solution:
The solution of Lorentz equations by the Heun’s method with step size 0.1 gives unstable solution.
Explanation of Solution
Given Information:
Lorentz equations,
and Initial conditions are
Formula used:
The iteration formula for Heun’s method is,
Calculation:
Consider the equations,
The following VBA code is used to solve the Lorentz equation by Heun’s method:
Code:
Output:
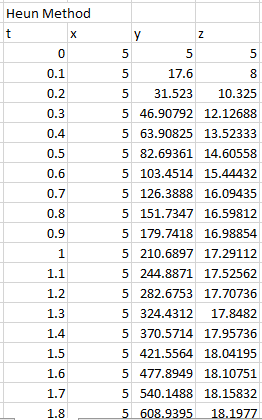
To draw the graph of the above results, follow the steps in excel sheet as given below,
Step 1: Select the cell from A4 to A205 and cell B4 to B205. Then, go to the Insert and select the scatter with smooth lines from the chart.
Step 2: Select the cell from A4 to A205 and cell C4 to C205. Then, go to the Insert and select the scatter with smooth lines from the chart.
Step 2: Select the cell from A4 to A205 and cell D4 to D205. Then, go to the Insert and select the scatter with smooth lines from the chart.
Step 4: Select one of the graphs and paste it on another graph to merge the graphs.
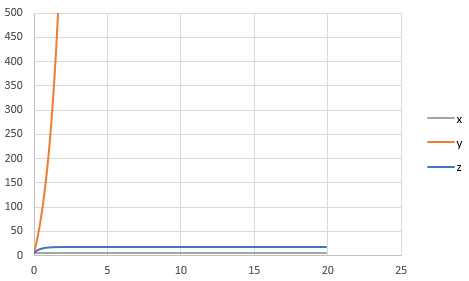
The graph obtained is,
And, to draw the phase plane plot follow the steps as below,
Step 4: Select the column B, column C and column D. Then, go to the Insert and select the scatter with smooth lines from the chart.
The graph obtained is,
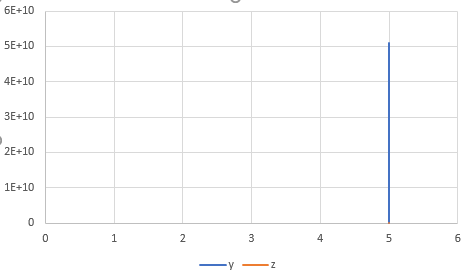
The phase plane plot is a straight line because solution of x is a constant value. The solution o0f Lorentz equation by Heun’s method with step size 0.1 is thus unstable.
(c)
To calculate: The solution of Lorentz equation
Answer to Problem 18P
Solution:
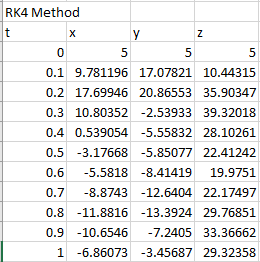
The first few solutions of Lorentz equation are,
| t | x | y | z |
| 0 | 5 | 5 | 5 |
| 0.1 | 9.781196 | 17.07821 | 10.44315 |
| 0.2 | 17.69946 | 20.86553 | 35.90347 |
| 0.3 | 10.80352 | -2.53933 | 39.32018 |
| 0.4 | 0.539054 | -5.55832 | 28.10261 |
| 0.5 | -3.17668 | -5.85077 | 22.41242 |
| 0.6 | -5.5818 | -8.41419 | 19.9751 |
| 0.7 | -8.8743 | -12.6404 | 22.17497 |
| 0.8 | -11.8816 | -13.3924 | 29.76851 |
| 0.9 | -10.6546 | -7.2405 | 33.36662 |
| 1 | -6.86073 | -3.45687 | 29.32358 |
Explanation of Solution
Given Information:
Lorentz equations,
and Initial conditions are
Formula used:
The fourth-order RK method for
Where,
Calculation:
The following VBA code is used to find the solution of Lorentz equation by the fourth order RK method:
Code:
Output:
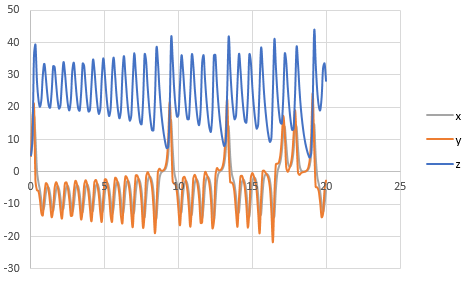
To draw the graph of the above results, follow the steps in excel sheet as given below,
Step 1: Select the cell from A4 to A205 and cell B4 to B205. Then, go to the Insert and select the scatter with smooth lines from the chart.
Step 2: Select the cell from A4 to A205 and cell C4 to C205. Then, go to the Insert and select the scatter with smooth lines from the chart.
Step 3: Select the cell from A4 to A205 and cell D4 to D205. Then, go to the Insert and select the scatter with smooth lines from the chart.
Step 4: Select one of the graphs and paste it on another graph to merge the graphs.
The graph obtained is,
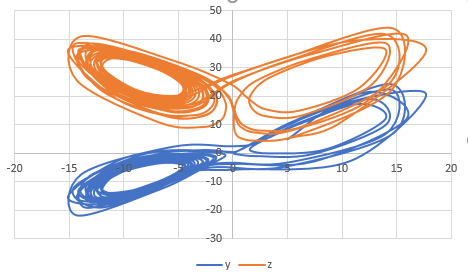
And, to draw the phase plane plot follow the steps as below,
Step 4: Select the column B, column C and column D. Then, go to the Insert and select the scatter with smooth lines from the chart.
The graph obtained is,
(d)
The solution of Lorentz equation
Answer to Problem 18P
Solution:
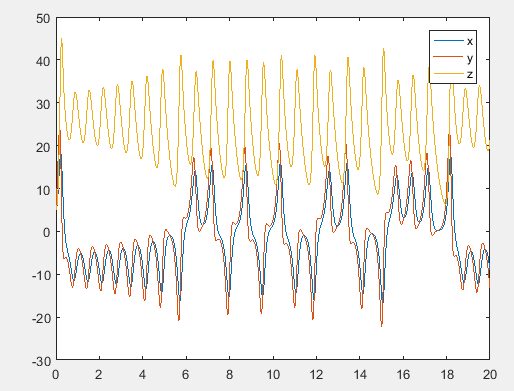
The solution graph of Lorentz equation is,
Explanation of Solution
Given Information:
Lorentz equations,
and Initial conditions are
Consider the Lorentz equations,
Use MATLAB ode45 function to solve the above differential functions as below,
Code:
Output:
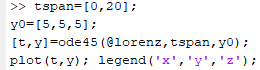
The graph obtained as,
Write the command as below to plot the phase-plane,

The phase plane graph obtained as,
Want to see more full solutions like this?
Chapter 28 Solutions
Numerical Methods For Engineers, 7 Ed
Additional Math Textbook Solutions
Advanced Engineering Mathematics
Basic Technical Mathematics
Fundamentals of Differential Equations (9th Edition)
Excursions in Modern Mathematics (9th Edition)
Precalculus: Mathematics for Calculus (Standalone Book)


- A new town was incorporated in 1960. The size of the town's population was recorded every 5 years after 1960. Using the variables x, for number of years since 1960, and y, for the size of the population, three models were created to predict the population from the number of years since 1960.arrow_forwardО О VCarrow_forwardHelp with parts a through e, having some difficulty with the phase lines.arrow_forward
- 8. Determine the stability of i = 1 x and sketch its phase portrait.arrow_forwardFrom its past behavior, John knows that the value of a stock has a cyclical component that increases for the first three months of each year, falls for the next six, and rises again for the last three. In addition, inflation adds a linear component to the stock's price. John is seeking a model of the form tt f(t) = mt + b + A sin 6 with t in months since Jan 1. He has the following data in the table: Oct 1 Apr 1 Price $20.00 $37.50 $35.00 $32.50 Date Jan 1 Jul 1 Jan 1 $50.00 a) What is the length of the period in his model? b) Find value of m, b, and A so that f fits the data.arrow_forwardConsider a disease where immunity is lost. On average, after n days, a recovered person becomes susceptible again. Adjust the equations for ds/dt, di/dt, and dr/dt in the SIR model to account for this. The equations should use s(t), i(t), r(t), b, k, and n. As a reminder, the original SIR equations are below, where 1/k is the average number of days a person is infected, and b is the average number of “close contacts” an infected person makes per day. ds/dt=−i(t)*b*s(t) di/dt=i(t)*b*s(t)−ki(t) dr/dt=k*i(t)arrow_forward
- From its past behavior, John knows that the value of a stock has a cyclical component that increases for the first three months of each year, falls for the next six, and rises again for the last three. In addition, inflation adds a linear component to the stock's price. John is seeking a model of the form f(t) = mt + b + A sin with t in months since Jan 1. He has the following data in the table: Jan 1 Apr 1 Jul 1 Price $20.00 $37.50 $35.00 $32.50 $50.00 Date Oct 1 Jan 1 a) What is the length of the period in his model? b) Determine two months when the Price is on the slanted midline. c) Find value of m, b, and A so that f fits the data.arrow_forwardFrom its past behavior, John knows that the value of a stock has a cyclical component that increases for the first three months of each year, falls for the next six, and rises again for the last three. In addition, inflation adds a linear component to the stock's price. John is seeking a model of the form f(t) = mt + b + A sin (-) with t in months since Jan 1. He has the following data in the table: Jan 1 Apr 1 Oct 1 Jan 1 Date Jul 1 Price $20.00 $37.50 $35.00 $32.50 $50.00 a) What is the length of the period in his model? b) Determine two months when the Price is on the slanted midline. c) Find value ofm, b, and A so that f fits the data.arrow_forward1). Consider the logistic equation in the form P'(t) = CP − P2. C = 4 Draw the directional field. Find the stability of the equilibria.(If an answer does not exist, enter DNE.) smaller value P= larger value P= please show step by step. pleasearrow_forward
 Calculus For The Life SciencesCalculusISBN:9780321964038Author:GREENWELL, Raymond N., RITCHEY, Nathan P., Lial, Margaret L.Publisher:Pearson Addison Wesley,
 Algebra & Trigonometry with Analytic GeometryAlgebraISBN:9781133382119Author:SwokowskiPublisher:Cengage