Concept explainers
Videos
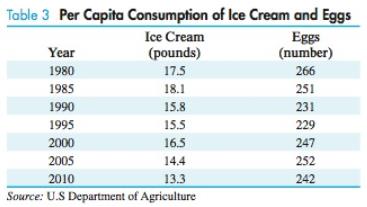
Diet. Table 3 shows the per capita consumption of ice cream and eggs in the United States for selected years since 1980.
(A) Let
(B) Use the polynomial model from part (A) to estimate (to the nearest tenth of a pound) the per capita consumption of ice cream in 2025.
Want to see the full answer?
Check out a sample textbook solution
Chapter 2 Solutions
Finite Mathematics for Business, Economics, Life Sciences and Social Sciences Plus NEW MyLab Math with Pearson eText -- Access Card Package (13th Edition)
Additional Math Textbook Solutions
Precalculus: Mathematics for Calculus (Standalone Book)
Elementary Statistics: Picturing the World (7th Edition)
A First Course in Probability (10th Edition)
Elementary & Intermediate Algebra
University Calculus: Early Transcendentals (4th Edition)
Probability And Statistical Inference (10th Edition)


- 6 Numerical Methods: Root-Finding Algorithms Task: Refer to Question 6 in the provided document. Link: https://drive.google.com/file/d/1wKSrun-GlxirS3IZ9qo Hazb9tC440 AZF/view?usp=sharing 7 Group Theory: Sylow's Theorems Task: Refer to Question 7 in the provided document. Link: https://drive.google.com/file/d/1wKSrun-GlxirS31Z9qo Hazb9tC440 AZF/view?usp=sharingarrow_forward2 Real Analysis: Uniform Convergence Task: Refer to Question 2 in the provided document. Link: https://drive.google.com/file/d/1wKSrun-GlxirS31Z9qo Hazb9tC440 AZF/view?usp=sharingarrow_forward5 Topology: Compactness and Connectedness Task: Refer to Question 5 in the provided document. Link: https://drive.google.com/file/d/1wKSrun-GlxirS31Z9qo Hazb9tC440 AZF/view?usp=sharing 6 Numerical Methods: Root-Finding Algorithms Task: Refer to Question 6 in the provided document. Link: https://drive.google.com/file/d/1wKSrun-GlxirS31Z9qo Hazb9tC440 AZF/view?usp=sharingarrow_forward
- 3 Calculus of Variations: Euler-Lagrange Equation Task: Refer to Question 3 in the provided document. Link: https://drive.google.com/file/d/1wKSrun-GlxirS31Z9qo Hazb9tC440 AZF/view?usp=sharing 4 Differential Equations: Stability Analysis Task: Refer to Question 4 in the provided document. Link: https://drive.google.com/file/d/1wKSrun-GlxirS3IZ9qo Hazb9tC440 AZF/view?usp=sharingarrow_forwardTask: Complex Analysis: Residue Theorem Refer to Question 8 in the provided document. Link: https://drive.google.com/file/d/1wKSrun-GlxirS31Z9qoHazb9tC440 AZF/view?usp=sharing Task: Functional Analysis: Banach and Hilbert Spaces Refer to Question 9 in the provided document. Link: https://drive.google.com/file/d/1wkSrun-GlxirS31Z9qoHazb9tC440 AZF/view?usp=sharingarrow_forwardLinear Algebra: Eigenvalues and Eigenvectors er to page 1 for eigenvalue decomposition techniques. ructions: Analyze the matrix provided in the link to calculate eigenvalues and eigenvectors. Discuss how eigenvalues and eigenvectors are applied in solving systems of linear equations. Evaluate the significance of diagonalizability in matrix transformations. Link: [https://drive.google.com/file/d/1wKSrun-GlxirS31Z9qo Hazb9tC440AZF/view?usp=sharing]arrow_forward
- 11 Set Theory: Cardinality of Infinite Sets Task: Refer to Question 11 in the provided document. Link: https://drive.google.com/file/d/1wKSrun-GlxirS31Z9qoHazb9tC440 AZF/view?usp=sharing 12 Partial Differential Equations: Heat Equation Task: Refer to Question 12 in the provided document. Link: https://drive.google.com/file/d/1wKSrun-GlxirS31Z9qoHazb9tC440 AZF/view?usp=sharingarrow_forwardTask: Linear Algebra: Eigenvalues and Eigenvectors Refer to Question 1 in the provided document. Link: https://drive.google.com/file/d/1wKSrun-GlxirS31Z9qo Hazb9tC440 AZF/view?usp=sharingarrow_forwardCalculus: Multivariable Optimization r to page 2 for constrained optimization techniques. uctions: Analyze the function provided in the link and identify critical points using the Lagrange multiplier method. Discuss the importance of second-order conditions for determining maxima and minima. Evaluate applications of multivariable optimization in real-world problems. Link: [https://drive.google.com/file/d/1wKSrun-GlxirS31Z9qo Hazb9tC440AZF/view?usp=sharing]arrow_forward
- Not use ai pleasearrow_forwardRefer to page 3 for stability in differential systems. Instructions: 1. 2. Analyze the phase plane of the system provided in the link to determine stability. Discuss the role of Lyapunov functions in proving stability. 3. Evaluate the impact of eigenvalues of the Jacobian matrix on the nature of equilibria. Link: [https://drive.google.com/file/d/1wKSrun-GlxirS31Z9qoHazb9tC440AZF/view?usp=sharing]arrow_forwardRefer to page 10 for properties of Banach and Hilbert spaces. Instructions: 1. Analyze the normed vector space provided in the link and determine if it is complete. 2. Discuss the significance of inner products in Hilbert spaces. 3. Evaluate examples of Banach spaces that are not Hilbert spaces. Link: [https://drive.google.com/file/d/1wKSrun-GlxirS3IZ9qoHazb9tC440AZF/view?usp=sharing]arrow_forward
 Glencoe Algebra 1, Student Edition, 9780079039897...AlgebraISBN:9780079039897Author:CarterPublisher:McGraw Hill
 Algebra & Trigonometry with Analytic GeometryAlgebraISBN:9781133382119Author:SwokowskiPublisher:Cengage

 College Algebra (MindTap Course List)AlgebraISBN:9781305652231Author:R. David Gustafson, Jeff HughesPublisher:Cengage Learning
 Functions and Change: A Modeling Approach to Coll...AlgebraISBN:9781337111348Author:Bruce Crauder, Benny Evans, Alan NoellPublisher:Cengage Learning