
(a)
To plot the data and report the group means and standard deviations and explain what do the means suggest about the effect of logging on the number of tree species and explain are the conditions for inference with ANOVA met.
(a)
Answer to Problem 24.28E
The group means is
Explanation of Solution
In the question, it is given that the exercise
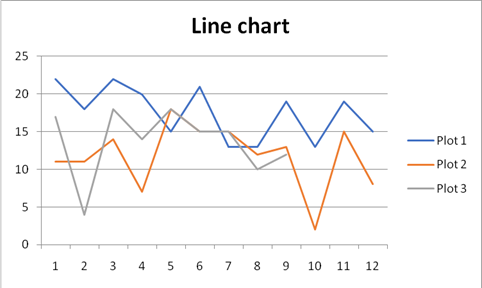
By looking at the line plot we can see that most of the data from the three plot is in the middle part and therefore it is approximately
| SUMMARY | |||||
| Groups | Count | Sum | Average | Variance | Standard deviations |
| Plot 1 | 12 | 210 | 17.5 | 12.4545454545455 | =SQRT(CE28) |
| Plot 2 | 12 | 141 | 11.75 | 19.1136363636364 | =SQRT(CE29) |
| Plot 3 | 9 | 123 | 13.6666666666667 | 20.25 | =SQRT(CE30) |
| =SUM(CB28:CB30) | =SUM(CC28:CC30) | ||||
| Grand mean= | =CC31/CB31 |
The results are:
| SUMMARY | |||||
| Groups | Count | Sum | Average | Variance | Standard deviations |
| Plot 1 | 12 | 210 | 17.5 | 12.45455 | 3.5291 |
| Plot 2 | 12 | 141 | 11.75 | 19.11364 | 4.371914 |
| Plot 3 | 9 | 123 | 13.66667 | 20.25 | 4.5 |
| 33 | 474 | ||||
| Grand mean= | 14.36364 | ||||
Thus, the third condition for ANOVA is that the largest sample standard deviation is no more than twice as large as the smallest standard deviation, so we have the ratio as:
Thus, it is also satisfied therefore all the inferences for ANOVA are met. And the means suggest about the effect of logging on the number of tree species that all the plots averages are approximately equal and therefore, there is not very much difference in means for the three plot for species.
(b)
To carry out the ANOVA and report the F statistic and its P-value and conclude in context.
(b)
Answer to Problem 24.28E
The F statistic is
Explanation of Solution
In the question, it is given that the exercise
Null hypothesis:
Alternative hypothesis: At least one of them is different.
Thus, by using the software excel we select the data and with the help of data analyses option in data tab we construct the ANOVA test and the result is as:
| ANOVA: Single Factor | ||||||
| SUMMARY | ||||||
| Groups | Count | Sum | Average | Variance | ||
| Plot 1 | 12 | 210 | 17.5 | 12.45455 | ||
| Plot 2 | 12 | 141 | 11.75 | 19.11364 | ||
| Plot 3 | 9 | 123 | 13.66667 | 20.25 | ||
| 33 | 474 | |||||
| Grand mean= | 14.36364 | |||||
| ANOVA | ||||||
| Source of Variation | SS | df | MS | F | P-value | F crit |
| Between Groups | 204.3864 | 2 | 102.1932 | 6.020217 | 0.006336 | 3.31583 |
| Within Groups | 509.25 | 30 | 16.975 | |||
| Total | 713.6364 | 32 | ||||
As we know that if the P-value is less than or equal to the significance level then the null hypothesis is rejected, so we have,
Thus, we have sufficient evidence to conclude that at least one of the mean is different from the other.
Want to see more full solutions like this?
Chapter 24 Solutions
Practice of Statistics in the Life Sciences

 MATLAB: An Introduction with ApplicationsStatisticsISBN:9781119256830Author:Amos GilatPublisher:John Wiley & Sons Inc
 Probability and Statistics for Engineering and th...StatisticsISBN:9781305251809Author:Jay L. DevorePublisher:Cengage Learning
 Statistics for The Behavioral Sciences (MindTap C...StatisticsISBN:9781305504912Author:Frederick J Gravetter, Larry B. WallnauPublisher:Cengage Learning
 Elementary Statistics: Picturing the World (7th E...StatisticsISBN:9780134683416Author:Ron Larson, Betsy FarberPublisher:PEARSON
 The Basic Practice of StatisticsStatisticsISBN:9781319042578Author:David S. Moore, William I. Notz, Michael A. FlignerPublisher:W. H. Freeman
 Introduction to the Practice of StatisticsStatisticsISBN:9781319013387Author:David S. Moore, George P. McCabe, Bruce A. CraigPublisher:W. H. Freeman