
Concept explainers
(a)
To find:
The
Answer to Problem 14E
The equilibrium
Explanation of Solution
Demand:
The quantity demanded of goods at different prices is referred as the demand for the goods. Demand curve is downward sloping.
Supply:
The quantity supplied of a good at different prices is referred as the supply of that good. Supply curve is upward sloping.
Market Equilibrium:
It refers to a situation where the forces of demand and supply are balanced.
(b)
To show:
The graphical representation of demand and supply curves.
Whether the demand and supply curves represent an individual firm's or market demand and supply curves, assuming market to be
Answer to Problem 14E
The graph of demand and supply curves is as shown below:
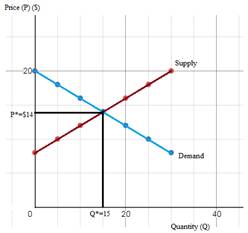
Figure (1)
The demand and supply curves given here are market demand and supply curves.
MC (Marginal Cost) is the supply curve and gives quantity supplied at each price for individual firm.
Explanation of Solution
In the Figure (1), the demand and supply curves and the equilibrium price and quantity are shown. Perfectly competitive market structure is one where there are large number of buyers and sellers. Other features of perfect competition are:
- Homogeneous products
- Industry is the price maker
- Firm is the price taker
- No individual buyer or seller can influence industry price
- Demand curve is AR curve which shows P=AR=MR.
Under perfect competition, individual firm's demand curve is the AR curve and since AR is constant for all levels of output, the demand curve is horizontal straight line. However, the market demand curve slopes downwards since it represents that industry output would be lower at a higher price and vice-versa.Therefore, the demand and supply curves given here are market demand and supply curves.
For a firm, quantity supplied is given by the MC curve. It is because, under perfect competition, at equilibrium, P=MR (=MC). Therefore, MC is the supply curvewhich gives quantity supplied at each price.
Perfect competition:
It is a market structure where large number of buyers and sellers exist, and products are homogeneous.
Market demand:
Market demand for a good is the summation of all individual demands for that good.
Market supply:
Market supply is the summation of all individual supplies of that good.
Marginal Cost (MC):
The additional cost of producing an extra unit of output is referred to as the marginal cost of producing that unit of output.
(c)
To show:
The
Answer to Problem 14E
At P*=$14 and Q*=15 units, the consumer surplus is$45, and the
Explanation of Solution
The consumer surplus and producer surplus are calculated below and shown graphically in the diagram below.
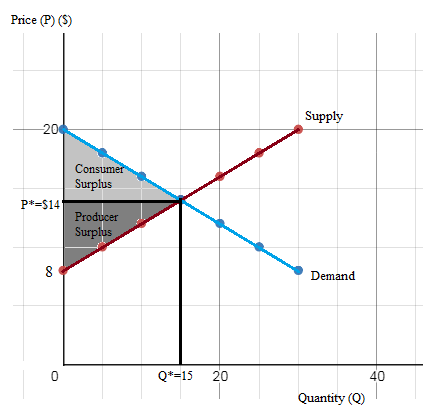
Figure (2)
Consumer surplus:
Consumer surplus is the difference between consumers' willingness to pay and the price that is charged to them. Graphically, it is the area between the demand curve and price line.
Producer surplus:
Producer surplus is the difference between the price producers receive and cost of production. Graphically, it is the area between the price line and the supply curve.
(d)
To explain:
The change in consumer and producer surplus as a result of a
Answer to Problem 14E
Change in consumer surplus after price ceiling is $15. That is, after price ceiling, consumer surplus increases by $15. The change in producer surplus after price ceiling is -$25. That is, after price ceiling, consumer surplus decreases by $25.
Change in consumer surplus after price floor is -$25. That is, after price floor, consumer surplus decreases by $25. The change in producer surplus after price floor is $15. That is, after price floor, producer surplus increases by $15.
Explanation of Solution
There is a price ceiling of $12 and equilibrium price is $14. Therefore, a price ceiling of $12 is binding. The effect of a price ceiling is shown in the diagram below. The new consumer and producer surplus with a price ceiling of $12 is calculated below.
The diagram is as shown below:
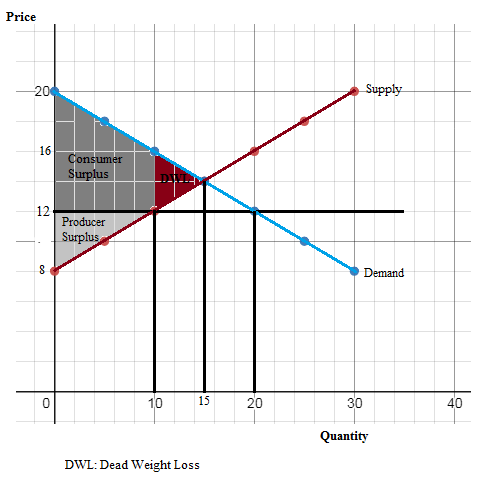
Figure (3)
Change in consumer surplus after price ceiling is $15. That is, after price ceiling, consumer surplus increases by $15.
Change in producer surplus after price ceiling is -$25. That is, after price ceiling, consumer surplus decreases by $25.
A price floor is binding if it is above equilibrium price. The equilibrium price without floor is $14. Therefore, a price floor of $16 would be binding. The effect of a price ceiling is shown in the diagram below. The new consumer and producer surplus with a price ceiling of $12 is calculated below.
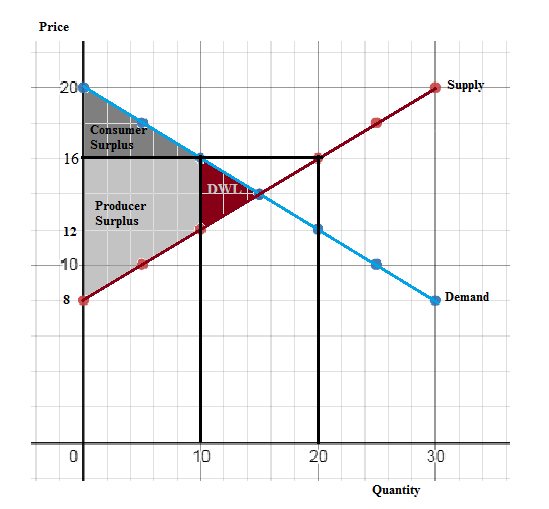
Figure (4)
Change in consumer surplus after price ceiling is -$25. That is, after price ceiling, consumer surplus decreases by $25.Change in producer surplus after price ceiling is $15. That is, after price ceiling, producer surplus increases by $15.
Consumer surplus:
Consumer surplus is the difference between consumers' willingness to pay and the price that is charged to them. Graphically, it is the area between the demand curve and price line.
Producer surplus:
Producer surplus is the difference between the price producers receive and cost of production. Graphically, it is the area between the price line and the supply curve.
Price ceiling:
A price ceiling is an upper limit for price which is generally imposed by the government.
Price floor:
A price floor is a lower limit for price which is generally imposed by the government.
Want to see more full solutions like this?


- In graph A below shows the market demand and supply in a competitive market, and graph B shows the cost curves of a representative firm in that industry. a. What are the market equilibrium price and quantity? Equilibrium price: $ Quantity traded:b. At equilibrium, what quantity is the firm producing? What is its total profit or loss? Leave no cells blank - be certain to enter "0" wherever required. Quantity: Total profit or loss $arrow_forwardAssume competitive markets (prices are given) and that the demand is more elastic than supply. Which of the following statements is correct? A. We do not have sufficient information to infer which surplus is greater B. Consumer surplus will be larger than producer surplustyping C. Consumer surplus will be exactly the same as producer surplus D. Consumer surplus will be smaller than producer surplus. Give typing answer with explanation and conclusionarrow_forwardHow do price controls affect the workings of a perfectly competitive market? Use a supply demand diagram as part of your answer.arrow_forward
- If the area above the supply curve and under the market price = producer surplus; does the area below the supply curve = cost of production? I need to figure out where this part is on the diagram. Thanks!arrow_forwardHow does the market equilibrium define what suppliers will stay in the market and what will leave the market? Explain based on the concept of producer surplusarrow_forward(Explain with graphics) A good can be produced in a competitive industry at a cost of $10 per unit. There are 100 consumers are each willing to pay $12 each to consume a single unit of the good (additional units have no value to them.) What is the equilibrium price and quantity sold? The government imposes a tax of $1 on the good. What is the deadweight loss of this tax? (Explain with graphics)arrow_forward
- When a competitive market is in equilibrium, the buyers are those with the __________ willingness to pay, and the sellers are those with the __________ opportunity costs. A)highest; highes B)highest; lowest C)lowest; highest D)lowest: lowestarrow_forwardWrite a sentence or two defining the following terms in your own words. Give examples of each. a. Market Equilibrium Point b. Market Systemarrow_forwardThe Weinandt Family Farm in Wynot, NE raises livestock and grows crops. Commonly grown crops in Nebraska are corn and soybeans. Suppose you are helping a farm similar to the Weinandt Farm make decisions about how much corn to grow this year. As an agricultural product, the market for corn meets the requirements of a perfectly competitive market. A) Using the market data provided, create a market supply and demand graph. B) What are the market equilibrium price and quantity? C) Using the firm cost and quantity data, find FC, VC, ATC, AFC, AVC, and MC. Graph ATC, AFC, AVC, and MC. D) Based on your answers in part c, between which quantities is ATC minimized? E) Based on your answers in part c, between which quantities should the farm aim to produce? F) Using the lower of these two quantities, caculate TR, TR, and the firm’s economic profit or loss. G) Will the farm decide to grow corn or leave the fields bare? explain your answer H) Will farms enter this market, leave the market, or…arrow_forward
- The Weinandt Family Farm in Wynot, NE raises livestock and grows crops. Commonly grown crops in Nebraska are corn and soybeans. Suppose you are helping a farm similar to the Weinandt Farm make decisions about how much corn to grow this year. As an agricultural product, the market for corn meets the requirements of a perfectly competitive market. A) Using the market data provided, create a market supply and demand graph. B) What are the market equilibrium price and quantity? C) Using the firm cost and quantity data, find FC, VC, ATC, AFC, AVC, and MC. Graph ATC, AFC, AVC, and MC. D) Based on your answers in part c, between which quantities is ATC minimized? E) Based on your answers in part c, between which quantities should the farm aim to produce? F) Using the lower of these two quantities, caculate TR, TR, and the firm’s economic profit or loss. G) Will the farm decide to grow corn or leave the fields bare? explain your answer H) Will farms enter this market, leave the market, or…arrow_forwardDefine a perfectly competitive market. A. Market that makes it possible for firms or businesses to reduce the quality of their products or services in order to cut their own costs B. Market model where many firms and businesses compete against each other to create an innovative product at the best cost, which ultimately benefits society C. Market where a firm or business has no competition in manufacturing a good or providing a service D. Market with few sellers and many buyersarrow_forwardQuestion With your own words explain what will happen in a perfectly competitive market if the Government intervene by setting a Price Floor. Illustrate with an example.arrow_forward

 Economics: Private and Public Choice (MindTap Cou...EconomicsISBN:9781305506725Author:James D. Gwartney, Richard L. Stroup, Russell S. Sobel, David A. MacphersonPublisher:Cengage Learning
 Microeconomics: Private and Public Choice (MindTa...EconomicsISBN:9781305506893Author:James D. Gwartney, Richard L. Stroup, Russell S. Sobel, David A. MacphersonPublisher:Cengage Learning