
Concept explainers
Videos
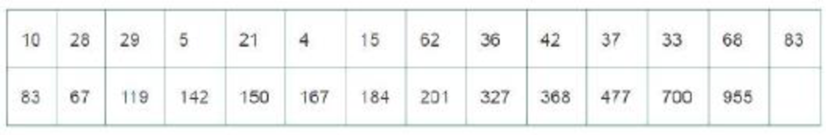
Volkswagen emissions scandal. Recently, the Environmental Protection Agency (EPA) cited Volkswagen (VW) for installing “defeat devices” that allowed VW vehicles to pass emissions inspections for 7 years while emitting 40 times the official limit of nitrogen oxide (NOx). Immediately, speculation began on how many people may have died over this time period due to ambient pollution caused by the excess nitrogen oxide in the air. A study published in Significance (December 2015) estimated the number of U.S. deaths attributable to NOx pollution produced from VW vehicles over the 7-year period. The researchers computed the estimate for each of 27 different scenarios involving different values of three variables: total distance (in miles) driven by these illegal VW vehicles, the amount by which the VW vehicles exceeded the EPA standard for NOx, and the estimated association between NOx emissions and mortality. The data (simulated from results reported in the study) are listed in the accompanying table.
- a. Use a relative frequency histogram to describe the distribution of estimated deaths for the 27 scenarios.
- b. Identify the class interval that includes the largest proportion of estimates. Explain why this interval is most likely to include the actual number of deaths attributable to NOx pollution over the 7-years
Want to see the full answer?
Check out a sample textbook solution
Chapter 2 Solutions
Statistics Plus New MyLab Statistics with Pearson eText -- Access Card Package (13th Edition)
Additional Math Textbook Solutions
Introductory Statistics (10th Edition)
Essential Statistics
Statistics for Psychology
Business Analytics
Statistics for Business & Economics, Revised (MindTap Course List)


- What does the y -intercept on the graph of a logistic equation correspond to for a population modeled by that equation?arrow_forwardResearchers recorded that a certain bacteria population declined from 700,000 to 400,000 in 5 hours after the administration of medication. At this rate of decay, how many bacteria will there be 24 hours from the start of the experiment?arrow_forwardWhat might a scatterplot of data points look like if it were best described by a logarithmic model?arrow_forward
- Does a linear, exponential, or logarithmic model best fit the data in Table 2? Find the model.arrow_forwardWith what kind of exponential model would doubling time be associated? What role does doubling time play in these models?arrow_forwardA bacteria culture had a population of 13 million at 10:00 am and by 2:00 pm had grown to 21 million. Predict the population at 6:00 pm that same day.arrow_forward
- According to estimates, the global emissions of CO2 in the energy sector will total about 36 billion metric tons in 2020. The energy sector has been decarbonizing at a rate of 1% per year. estimated to be "decarbonizing" at a rate of 1% per year. Suppose that the energy sector continued to decarbonize at the historical rate of 1% per year. Estimate the amount of time it would take for global emissions of CO2 from the energy sector to drop below 8 billion metric tons per year. Round your answer to the nearest year.arrow_forwardplease answer correctly:arrow_forwardA certain allergen affects approximately 3 people per 10,000 in the United States. Assuming the U.S. population is approximately 326 million people, how many people suffer from this allergen? (See Example 4 in this section.)arrow_forward
- One of the factors that determines the degree of risk a pesticide poses to human health is the rate at which the pesticide is absorbed into skin after contact. An important question is whether the amount in the skin continues to increase with the length of the contact, or whether it increases for only a short time before leveling off. To investigate this, measured amounts of a certain pesticide were applied to 20 samples of rat skin. Four skins were analyzed at each of the time intervals 1 , 2 , 4 , 10 , and 24 hours. The amounts of the chemical (in micrograms) that were in the skin are given in the following table. Duration Amounts Absorbed 1 1.3 1.4 1.3 2.1 2 1.6 2.0 1.3 2.0 4 1.9 1.6 2.1 1.7 10 2.0 2.1 2.0 1.7 24 2.4 2.2 2.6 2.2 Can you conclude that the amount in the skin varies with time? Use the =α0.001 level of…arrow_forwardPlease don't provide hand writttin solution....arrow_forwardThe following table gives the millions of metric tons of carbon dioxide emissions in a certain country for selected years from 2010 and projected to 2032. 2012 2014 2016 2018 2020 CO2 Emissions 338.5 364.5 397.1 423.8 452.1 498.4 Year 2010 Year 2022 2024 2026 2028 2030 CO2 Emissions 557.2 592.9 628.7 662.1 707.1 (a) Create a linear function that models these data, with x as the number of years past 2010 and y as the millions of metric tons of carbon dioxide emissions. (Round all numerical values to two decimal places.) y(x) = 2032 741.7 (b) Find the model's estimate for the 2024 data point. (Round your answer to two decimal places.) million metric tons Interpret the slope of the linear model. For each year since ---Select--- (c) Find the slope of the linear model. (Round your answer to two decimal places.) , carbon dioxide emissions in the U.S. are expected to change by million metric tons.arrow_forward

 Algebra & Trigonometry with Analytic GeometryAlgebraISBN:9781133382119Author:SwokowskiPublisher:Cengage
 Glencoe Algebra 1, Student Edition, 9780079039897...AlgebraISBN:9780079039897Author:CarterPublisher:McGraw Hill
 College Algebra (MindTap Course List)AlgebraISBN:9781305652231Author:R. David Gustafson, Jeff HughesPublisher:Cengage Learning
 Trigonometry (MindTap Course List)TrigonometryISBN:9781337278461Author:Ron LarsonPublisher:Cengage Learning