Videos
To review:
On the basis of the given data, we are required to show the patterns of the hydrocarbons which are consistent with reinforcement.
Given:
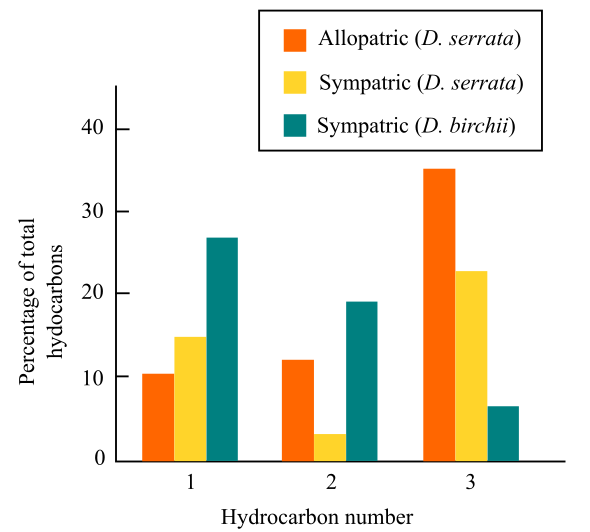
The graph given below shows the hydrocarbon concentration in the cuticle of allopatric and sympatric species of three species of Drosophila.
Introduction:
A study was conducted on the east coast of Australia, where two species of Drosophila, D. serrata and D. birchii, coexist and breed to produce hybrids. The hydrocarbon concentration in the allopatric and sympatric species was estimated to see the differences in them. The reinforcement mechanism was assumed to be the reason for such differences in the species.
Explanation of Solution
Reinforcement theory for
After studying the data given, the hydrocarbon 2 show a pattern, which is consistent with reinforcement. For reinforcement to be consistent, one needs to check the difference between the sympatric population and the other species, which should be greater than the difference between the allopatric populations and other species.
In case a barrier in gene flow is established, the reproduction isolation will begin by genetic divergence. Due to this, there are differences accumulated in the lineages. This reduces the probability of individuals mating with each other successfully, whenever they come into contact.
In case this isolation fails when the species come into contact, then some hybridization is bound to occur. The selection of the species will favor the parents. Due to this, the selection will result in the reinforcement of the mechanisms that prevent hybridization.
Therefore, it can be concluded that hydrocarbon 2 shows the correct pattern of reinforcement.
Want to see more full solutions like this?
Chapter 22 Solutions
LIFE:SCIENCE OF BIOL.(LL) >CUSTOM<


- A. Define null hypothesis in your own words. B. What is thr poiny of having a null hypothesis? C. What is the alternative hypothesis? D. Why do we need to test the null hypothesis instead of just proving an alternative hypothesis? F. You are t. Esting the effect of a particular fertilizer onba plant's growth. Your control plants don't get fertilizer while your test plants do. Whatvwould be your hypotheses and the null hypotheses?arrow_forwardExplain how Gause's experiment demonstrates inter-specific competition.arrow_forwardSuppose you want to examine the effect of a fertilizer on the size of eggplant produced, and therefore, you need to establish the experimental and control groups. A. What could represent the control group? B. What will be your experimental group? C. What will be the best way to establish a relationship between your two variables?arrow_forward
- Based on the data, what conclusions can you make? Explain in not more than 150 words.arrow_forwardA. Why do we need to test the null hypothesis instead of just proving an alternative hypothesis? B. You are testing the effect of a particular fertilizer on a plant's growth. Your control plants don't get fertilizer while your test plants do. What would be your hypotheses and the null hypotheses?arrow_forwardinterpret these results and explain these as detailed as possible include an explanation of why the results demonstrate what they do and possible explanations for thisarrow_forward
- Give a clear handwritten answer with explanation..give only correct answer..arrow_forwardIf possible please answer all four questions. For each hypothesis, identify the independent and dependent variable. Also, decide on an appropriate control group and form of data. Thank you.arrow_forwardGive typing answer with explanation and conclusion What role might you play in improving the theory-practice gap?arrow_forward
- Consider the variables: A, B, C, D, E, F, G, and H. A and B, B and C, C and D are directly related while D and E, E and F, F and G, and G and H are inversely related. If an initial increase occurs in the value of A, the value of H will a. decrease b. increase c. stay the same d. cannot predict from the given informationarrow_forwardWhat is the function of QA and QC? Write the difference between QA and QC? Please answer at your own easy words .arrow_forwardYou are asked to draw and explain the goal of the Meselson-Stahl (1958) Experiment as outlined in the classroom. You need to draw your own diagram and use short sentences to explain the steps and/or important points, deductions. Clearly state what happens at each step.arrow_forward
 Human Anatomy & Physiology (11th Edition)BiologyISBN:9780134580999Author:Elaine N. Marieb, Katja N. HoehnPublisher:PEARSON
 Biology 2eBiologyISBN:9781947172517Author:Matthew Douglas, Jung Choi, Mary Ann ClarkPublisher:OpenStax
 Anatomy & PhysiologyBiologyISBN:9781259398629Author:McKinley, Michael P., O'loughlin, Valerie Dean, Bidle, Theresa StouterPublisher:Mcgraw Hill Education,
 Molecular Biology of the Cell (Sixth Edition)BiologyISBN:9780815344322Author:Bruce Alberts, Alexander D. Johnson, Julian Lewis, David Morgan, Martin Raff, Keith Roberts, Peter WalterPublisher:W. W. Norton & Company
 Laboratory Manual For Human Anatomy & PhysiologyBiologyISBN:9781260159363Author:Martin, Terry R., Prentice-craver, CynthiaPublisher:McGraw-Hill Publishing Co.
 Inquiry Into Life (16th Edition)BiologyISBN:9781260231700Author:Sylvia S. Mader, Michael WindelspechtPublisher:McGraw Hill Education