
The impact of the elasticity on the demand and supply of the agricultural products and on its quantity and price .
Explanation of Solution
Due to the inelastic nature of the demand for the agricultural products, the shift in the supply curve of the agricultural products leads to a large change in the
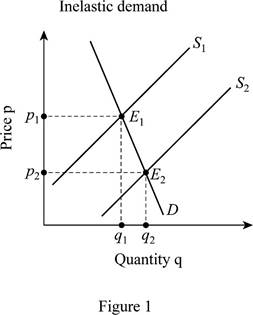
In Figure 1, the demand curve is relatively inelastic as compared to the supply curve. The new equilibrium (E2) shows that there has been a small change in the quantity of the demand with the drastic change in the price.
The volatile nature of the exports increases the instability of the demand for the agricultural products. The exports change from year to year; so, there is an increase in the instability for the demand of the agricultural products.
Concept Introduction
Supply and demand of the agricultural products: The demand for the agricultural products is inelastic in nature because a large change in the prices has a very small impact on the demand for the agricultural products. The supply of the agricultural products is elastic in nature.
Want to see more full solutions like this?
Chapter 22 Solutions
ECONOMICS W/CONNECT+20 >C<

- 3. Refer to the expanded table below from review question 8. LO3.4 a. What is the equilibrium price? At what price is there nei- ther a shortage nor a surplus? Fill in the surplus-shortage column and use it to confirm your answers. b. Graph the demand for wheat and the supply of wheat. Be sure to label the axes of your graph correctly. Label equi- librium price Pand equilibrium quantity Q. c. How big is the surplus or shortage at $3.40? At $4.90? How big a surplus or shortage results if the price is 60 cents higher than the equilibrium price? 30 cents lower than the equilibrium price? Thousands of Bushels Surplus (+) or Shortage (-) Thousands Price per Bushel of Bushels Supplied Demanded 85 $3.40 72 80 3.70 73 75 4.00 75 70 4.30 77 65 4.60 79 60 4.90 81arrow_forwardplease make sure the answer is correct 100%arrow_forwardADVANCED ANALYSIS Assume that demand for a commodity is represented by the equation P=20−2Qd.P=20−2Qd.Supply is represented by the equation P=−5+3Qs,P=−5+3Qs,where Qd and Qs are quantity demanded and quantity supplied, respectively, and P is price.Instructions: Round your answer for price to 2 decimal places and enter your answer for quantity as a whole number. Using the equilibrium condition Qs = Qd, solve the equations to determine equilibrium price and equilibrium quantity. Equilibrium price = ? $ Equilibrium quantity = ? unitsarrow_forward
- ADVANCED ANALYSIS Assume that demand for a commodity is represented by the equation P=80−2Qd.P=80−2Qd. Supply is represented by the equation P=−20+2Qs,P=−20+2Qs, where Qd and Qs are quantity demanded and quantity supplied, respectively, and P is price.Instructions: Round your answer for price to 2 decimal places and enter your answer for quantity as a whole number. Using the equilibrium condition Qs = Qd, solve the equations to determine equilibrium price and equilibrium quantity.arrow_forwardWill the equilibrium price of orange juice increase or decrease in each of the following situations? LO7a. A medical study reporting that orange juice reduces cancer is released at the same time that a freak storm destroys half of the orange crop in Florida. The prices of all beverages except orange juice fall in half while unexpectedly perfect weather in Florida results in an orange crop that is 20 percent larger than normal.arrow_forwardNext, complete the following graph, labeled Scenario 2, by shifting the supply and demand curves in the same way that you did on the Scenario 1 graph. PRICE (Dollars per pen) 10 9 8 co LO 5 + 3 2 1 0 0 1 Price Quantity 2 Equilibrium Object True Scenario 2 3 False Supply 4 5 6 7 QUANTITY (Millions of pens) Demand Scenario 1 8 9 Compare both the Scenario 1 and Scenario 2 graphs. Notice that after completing both graphs, you can now see a difference between them that wasn't apparent before the shifts because each graph indicates different magnitudes for the supply and demand shifts in the market for pens. 10 Use the results of your answers on both the Scenario 1 and Scenario 2 graphs to complete the following table. Begin by indicating the overall change in the equilibrium price and quantity after the shift in demand or supply for each shift-magnitude scenario. Then, in the final column, indicate the resulting change in the equilibrium price and quantity when supply and demand shift in…arrow_forward
- ADVANCED ANALYSIS Assume that demand for a commodity is represented by the equation P = 80 – 2Qd. Supply is represented by the equation P = -20 + 2Qs, where Qgand Qg are quantity demanded and quantity supplied, respectively, and Pis price. Instructions: Round your answer for price to 2 decimal places and enter your answer for quantity as a whole number. Using the equilibrium condition Qs = Qd, solve the equations to determine equilibrium price and equilibrium quantity. Equilibrium price = $ Equilibrium quantity = unitsarrow_forward...arrow_forward4. How will each of the following changes in demand and/or supply affect equilibrium price and equilibrium quantity in a competitive market; that is, do price and quantity rise, fall, or remain unchanged, or are the answers indeterminate be- cause they depend on the magnitudes of the shifts? Use sup- ply and demand to verify your answers. LO3.5 a. Supply decreases and demand is constant. b. Demand decreases and supply is constant. c. Supply increases and demand is constant. d. Demand increases and supply increases. e. Demand increases and supply is constant. f. Supply increases and demand decreases.arrow_forward
- ADVANCED ANALYSIS Assume that demand for a commodity is represented by the equation P = 20 – 2Qd. Supply is represented by the equation P = -5 + 3Qs, where Qgand Qs are quantity demanded and quantity supplied, respectively, and Pis price. Instructions: Round your answer for price to 2 decimal places and enter your answer for quantity as a whole number. Using the equilibrium condition Qs= Qd solve the equations to determine equilibrium price and equilibrium quantity. Equilibrium price = $ Equilibrium quantity = unitsarrow_forwardWhat is the Equilibrium price ? Equilibrium quantity?arrow_forwardThe picture below is the full question Please labelarrow_forward

 Principles of Economics (12th Edition)EconomicsISBN:9780134078779Author:Karl E. Case, Ray C. Fair, Sharon E. OsterPublisher:PEARSON
 Engineering Economy (17th Edition)EconomicsISBN:9780134870069Author:William G. Sullivan, Elin M. Wicks, C. Patrick KoellingPublisher:PEARSON
 Principles of Economics (MindTap Course List)EconomicsISBN:9781305585126Author:N. Gregory MankiwPublisher:Cengage Learning
 Managerial Economics: A Problem Solving ApproachEconomicsISBN:9781337106665Author:Luke M. Froeb, Brian T. McCann, Michael R. Ward, Mike ShorPublisher:Cengage Learning
 Managerial Economics & Business Strategy (Mcgraw-...EconomicsISBN:9781259290619Author:Michael Baye, Jeff PrincePublisher:McGraw-Hill Education