
EBK STATISTICS FOR BUSINESS AND ECONOMI
13th Edition
ISBN: 8220103633567
Author: Sincich
Publisher: PEARSON
expand_more
expand_more
format_list_bulleted
Videos
Textbook Question
Chapter 2.1, Problem 2.12ACI
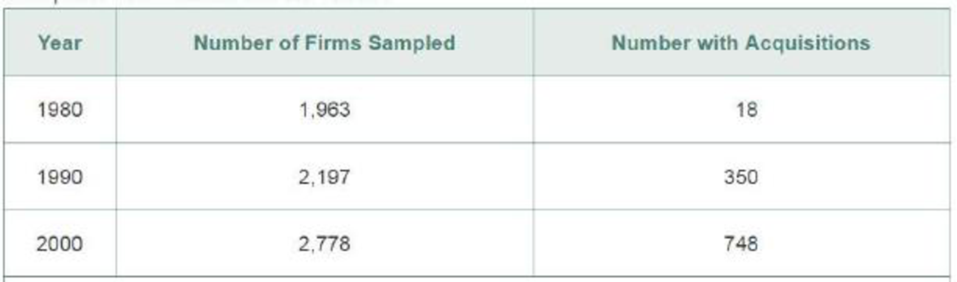
History of corporate acquisitions. A corporate acquisition occurs when one corporation purchases all the stock shares of another, essentially taking over the other. The Academy of Management Journal (August 2008) investigated the performance and timing of corporate acquisitions for a large sample of firms over the years 1980 to 2000. The accompanying data table gives the number of firms sampled and number that announced one or more acquisitions during the years 1980, 1990, and 2000. Construct side-by-side bar charts to describe the firms with and without acquisitions in the 3 years. Compare and contrast the bar charts.
Expert Solution & Answer
Want to see the full answer?
Check out a sample textbook solution
Students have asked these similar questions
You own the only pharmacy in the small town of Jackson City, which has 40,000 residents. You would like to get a sense of what the local demand is for seasonal allergy medicine so you can determine how many packages to keep in stock and what price to charge. You conduct a survey of four residents of Jackson City, asking them about the quantity of allergy medicine they would buy each allergy season at various prices. Their responses are shown in the accompanying table. Estimate and graph the demand for the entire town of Jackson City.
Price
Lee
June
Carlotta
Eric
$8
8
5
6
9
$10
6
4
5
5
$12
4
3
4
3
$14
2
2
2
1
$18
0
1
1
0
I submitted this question earlier and I understand how to add up the market demand for each individual but I don't understand how to estimate the entire market demand for Jackson city which has 40,000 residents including the individuals listed in the chart. If you could please answer this specifically I would appreciate it.
Macmillan Learning
Consider the CEO of a company that sells coffee at small free standing shops around the country. The Board of Directors is
considering increasing the number of locations in an effort to increase total revenue, ceteris paribus. Use the data to determine
if revenue is responsive to the number of locations. Use the midpoint method to calculate percentages.
Number of locations
Total revenue
Calculate the percentage change in locations.
2012
3000
$60 million
Calculate the percentage change in total revenue.
Based on the CEO's analysis, he reports to the Board that
total revenue is inelastic with respect to the number
of locations.
total revenue is unit elastic with respect to the
number of locations.
total revenue is elastic with respect to the number
of locations.
2013
3750
$75 million
percentage change in total revenue:
percentage change in locations:
%
%
According to Wine-Searcher, wine critics generally use a wine-scoring scale to communicate their opinions on the relative quality of wines. Wine scores range
from 0 to 100, with a score of 95 – 100 indicating a great wine, 90 – 94 indicating an outstanding wine, 85 – 89 indicating a very good wine, 80 – 84
indicating a good wine, 75 - 79 indicating a mediocre wine, and below 75 indicating that the wine is not recommended. Random ratings of a pinot noir recently
produced by a newly established vineyard in 2018 follow:
Excel File: data07-11.xlsx
87
91
86
82
72
91
60
77
80
79
83
96
a. Develop a point estimate of mean wine score for this pinot noir (to 2 decimals).
b. Develop a point estimate of the standard deviation for wine scores received by this pinot noir (to 4 decimals).
Chapter 2 Solutions
EBK STATISTICS FOR BUSINESS AND ECONOMI
Ch. 2.1 - Complete the following table.Ch. 2.1 - A qualitative variable with three classes (X, Y,...Ch. 2.1 - STEM experiences for girls. The National Science...Ch. 2.1 - Cable TV subscriptions and cord cutters. Has the...Ch. 2.1 - Do social robots walk or roll? A social (or...Ch. 2.1 - Top credit card issuers, by region. The Nilson...Ch. 2.1 - Microsoft program security issues. To help its...Ch. 2.1 - Jamming attacks on wireless networks. Refer to the...Ch. 2.1 - The Apprentice contestants performance ratings....Ch. 2.1 - The economic return to earning an MBA. Refer to...
Ch. 2.1 - Profiling UK rental malls. An analysis of the...Ch. 2.1 - History of corporate acquisitions. A corporate...Ch. 2.1 - Twitter opinions of iPhone 6 features. What are...Ch. 2.1 - Museum management. What criteria do museums use to...Ch. 2.1 - Advertising with reader-response cards....Ch. 2.1 - Motivation and right-oriented bias. Evolutionary...Ch. 2.1 - Groundwater contamination in wells. In New...Ch. 2.2 - Graph the relative frequency histogram for the 500...Ch. 2.2 - Refer to Exercise 2.18. Calculate the number of...Ch. 2.2 - Consider the stem-and-leaf display shown here. a....Ch. 2.2 - Minitab was used to generate the following...Ch. 2.2 - Stability of compounds in new drugs. Testing the...Ch. 2.2 - Corporate sustainability of CPA firms. Refer to...Ch. 2.2 - Sanitation inspection of cruise ships. To minimize...Ch. 2.2 - History of corporate acquisitions. Refer to the...Ch. 2.2 - Most valuable NFL teams. Each year Forbes reports...Ch. 2.2 - State SAT scores. Educators are constantly...Ch. 2.2 - Items arriving and departing a work center. In a...Ch. 2.2 - Crude oil biodegradation. In order to protect...Ch. 2.2 - Volkswagen emissions scandal. Recently, the...Ch. 2.2 - Is honey a cough remedy? Does a teaspoon of honey...Ch. 2.2 - Time in bankruptcy. Financially distressed firms...Ch. 2.2 - Prob. 2.33ACACh. 2.2 - Prob. 2.34ACACh. 2.3 - Calculate the mean and median of the following...Ch. 2.3 - Calculate the mean for samples where a. n = 10, x...Ch. 2.3 - Explain how the relationship between the mean and...Ch. 2.3 - Explain the difference between the calculation of...Ch. 2.3 - Calculate the mode, mean, and median of the...Ch. 2.3 - Calculate the mean, median, and mode for each of...Ch. 2.3 - Describe how the mean compares to the median for a...Ch. 2.3 - Use the applet entitled Mean versus Median to find...Ch. 2.3 - Prob. 2.2AECh. 2.3 - Use the applet Mean versus Median to study the...Ch. 2.3 - Hotels use of ecolabels. Ecolabels such as Energy...Ch. 2.3 - Rankings of research universities. Based on...Ch. 2.3 - Performance of stock screeners. Investment...Ch. 2.3 - Performance-based logistics. Refer to the Journal...Ch. 2.3 - Surface roughness of oil field pipe. Oil field...Ch. 2.3 - Prob. 2.47ACICh. 2.3 - Corporate sustainability of CPA firms. Refer to...Ch. 2.3 - Is honey a cough remedy? Refer to the Archives of...Ch. 2.3 - Crude oil biodegradation. Refer to the Journal of...Ch. 2.3 - Symmetric or skewed? Would you expect the data...Ch. 2.3 - Prob. 2.52ACICh. 2.3 - Prob. 2.53ACACh. 2.3 - Prob. 2.54ACACh. 2.3 - Prob. 2.55ACACh. 2.4 - Answer the following questions about variability...Ch. 2.4 - Calculate the range, variance, and standard...Ch. 2.4 - Calculate the variance and standard deviation for...Ch. 2.4 - Compute x,s2, and s for each of the following data...Ch. 2.4 - Calculate the range, variance, and standard...Ch. 2.4 - Using only integers between 0 and 10, construct...Ch. 2.4 - Using only integers between 0 and 10, construct...Ch. 2.4 - Consider the following sample of five...Ch. 2.4 - Use the applet entitled Standard Deviation to find...Ch. 2.4 - Use the applet Standard Deviation to study the...Ch. 2.4 - Use the applet Standard Deviation to study the...Ch. 2.4 - Hotels use of ecolabels. Refer to the Journal of...Ch. 2.4 - Permeability of sandstone during weathering. Refer...Ch. 2.4 - Performance of stock screeners. Refer to the...Ch. 2.4 - Corporate sustainability of CPA firms. Refer to...Ch. 2.4 - Is honey a cough remedy? Refer to the Archives of...Ch. 2.4 - Active nuclear power plants. Refer to Exercise...Ch. 2.4 - Estimating production time. A widely used...Ch. 2.5 - The output from a statistical software package...Ch. 2.5 - Prob. 2.72LMCh. 2.5 - For a set of data with a mound-shaped relative...Ch. 2.5 - The following is a sample of 25 measurements: a....Ch. 2.5 - Given a data set with a largest value of 760 and a...Ch. 2.5 - Voltage sags and swells. The power quality of a...Ch. 2.5 - Permeability of sandstone during weathering. Refer...Ch. 2.5 - Do social robots walk or roll? Refer to the...Ch. 2.5 - College dropout study. The American Economic...Ch. 2.5 - Motivation of drug dealers. Consider a study of...Ch. 2.5 - Sanitation inspection of cruise ships. Refer to...Ch. 2.5 - Volkswagen emissions scandal. Refer to the...Ch. 2.5 - Auditing water resources in Australia. Australia...Ch. 2.5 - The Apprentice contestants performance ratings....Ch. 2.5 - Shopping vehicle and judgment. While shopping at...Ch. 2.5 - Buy-side vs. sell-side analysts earnings...Ch. 2.5 - Prob. 2.87ACACh. 2.5 - Improving SAT scores. The National Education...Ch. 2.5 - Prob. 2.89ACACh. 2.6 - Compute the z-score corresponding to each of the...Ch. 2.6 - Give the percentage of measurements in a data set...Ch. 2.6 - In terms of percentiles, define QL, QM and QU.Ch. 2.6 - Compare the z-scores to decide which of the...Ch. 2.6 - Suppose that 40 and 90 are two elements of a...Ch. 2.6 - Mathematics assessment test scores. According to...Ch. 2.6 - Prob. 2.96ACBCh. 2.6 - Prob. 2.97ACBCh. 2.6 - Sanitation inspection of cruise ships Refer to the...Ch. 2.6 - Prob. 2.99ACICh. 2.6 - Prob. 2.100ACICh. 2.6 - Executive networking and firm performance. Do...Ch. 2.6 - Blue- vs. red-colored exam study. In a study of...Ch. 2.6 - Ranking PhD programs in economics. Thousands of...Ch. 2.6 - Using z-scores for grades. At one university, the...Ch. 2.6 - Prob. 2.105ACACh. 2.7 - A sample data set has a mean of 57 and a standard...Ch. 2.7 - Suppose a data set consisting of exam scores has a...Ch. 2.7 - Consider the horizontal box plot shown below. a....Ch. 2.7 - Prob. 2.109LMCh. 2.7 - Prob. 2.7AECh. 2.7 - Rankings of research universities. Refer to the...Ch. 2.7 - Voltage sags and swells. Refer to the Electrical...Ch. 2.7 - Treating psoriasis with the Doctorfish of Kangal....Ch. 2.7 - Budget lapsing at army hospitals. Accountants use...Ch. 2.7 - Salary offers to MBAs. Consider the top salary...Ch. 2.7 - Prob. 2.115ACICh. 2.7 - Prob. 2.116ACICh. 2.7 - Sanitation inspection of cruise ships. Referto...Ch. 2.7 - Network server downtime. A manufacturer of network...Ch. 2.7 - Permeability of sandstone during weathering. Refer...Ch. 2.7 - Prob. 2.120ACACh. 2.7 - Prob. 2.121ACACh. 2.8 - Construct a scatterplot for the data in the...Ch. 2.8 - Construct a scatterplot for the data in the...Ch. 2.8 - Prob. 2.124ACBCh. 2.8 - Prob. 2.125ACBCh. 2.8 - Lobster trap placement. Strategic placement of...Ch. 2.8 - Does elevation impact hitting performance in...Ch. 2.8 - Prob. 2.128ACBCh. 2.8 - Prob. 2.129ACBCh. 2.8 - Spreading rate of spilled liquid A contract...Ch. 2.8 - Performance ratings of government agencies. The...Ch. 2.8 - Most valuable NFL teams. Refer to the Forbes...Ch. 2.8 - Best-paid CEOs. Refer to Glassdoor Economic...Ch. 2.8 - Prob. 2.134ACACh. 2.10 - Museum management. Refer to the Museum Management...Ch. 2.10 - Volkswagen emissions scandal. Refer to the...Ch. 2.10 - BP oil leak. In the summer of 2010, an explosion...Ch. 2 - Construet a relative frequency histogram for the...Ch. 2 - Discuss the conditions under which the median is...Ch. 2 - Consider the following three measurements: 50, 70,...Ch. 2 - Refer to Exercise 2.141c. For parts a-d, determine...Ch. 2 - For each of the following data sets, compute x,...Ch. 2 - For each of the following data sets, compute x,...Ch. 2 - Explain why we generally prefer the standard...Ch. 2 - If the range of a set of data is 20, find a rough...Ch. 2 - Prob. 2.147LMCh. 2 - Motivation of drug dealers. Refer to the Applied...Ch. 2 - Slogs for Fortune 500 firms. Web site...Ch. 2 - Management system failures. The U.S. Chemical...Ch. 2 - Business marketing publications....Ch. 2 - U.S. business bankruptcies. The American...Ch. 2 - Prob. 2.153ACBCh. 2 - Products Made in the USA. Made in the USA is a...Ch. 2 - Prob. 2.155ACBCh. 2 - Drivers stopped by police. According to the Bureau...Ch. 2 - U.S. wine export markets. The Center for...Ch. 2 - Prob. 2.158ACICh. 2 - Hull failures of oil tankers. Owing to several...Ch. 2 - Software defects. The Promise Software Engineering...Ch. 2 - Prob. 2.161ACICh. 2 - Time to develop price quotes. A manufacturer of...Ch. 2 - Trend in Iraq War casualties. While the United...Ch. 2 - Prob. 2.164ACICh. 2 - Radiation levels in homes. In some locations,...Ch. 2 - Doctors and ethics. For physicians confronted with...Ch. 2 - Prob. 2.167ACICh. 2 - Investigating the claims of weight-loss clinics....Ch. 2 - Age discrimination study. The Age Discrimination...Ch. 2 - No Child Left Behind Act. According to the...Ch. 2 - Steel rod quality. In his essay Making Things...
Knowledge Booster


Learn more about
Need a deep-dive on the concept behind this application? Look no further. Learn more about this topic, economics and related others by exploring similar questions and additional content below.Similar questions
- The following data concern one of the most popular products of XYZ Manufacturing. Estimate the selling price per unit.arrow_forwardThe Wall Street Journal’s website, www.wsj.com, reported the number of cars and light-duty trucks sold through October of 2014 and October of 2015. The top sixteen manufacturers are listed here. The sales information for all manufacturers can be accessed in a data file below. Sales data are often reported in this way to compare current sales to last year’s sales. Year-to-Date Sales Manufacturer Through October 2015 Through October 2014 General Motors Corp. 2,562,840 2,434,707 Ford Motor Company 2,178,587 2,065,612 Toyota Motor Sales USA Inc. 2,071,446 1,975,368 Chrysler 1,814,268 1,687,313 American Honda Motor Co Inc. 1,320,217 1,281,777 Nissan North America Inc. 1,238,535 1,166,389 Hyundai Motor America 638,195 607,539 Kia Motors America Inc. 526,024 489,711 Subaru of America Inc. 480,331 418,497 Volkswagen of America Inc. 294,602 301,187 Mercedes-Benz 301,915 281,728 BMW of North America Inc.…arrow_forwardBank clients were asked to indicate their level of satisfaction with the service provided by the bank’s tellers. Responses from a random sample of customers were as follows: 69 were very satisfied, 55 were moderately satisfied, 5 had no opinion, 3 were moderately dissatisfied, and 2 were very dissatisfied. a. Construct a bar chart. b. Construct a pie chart.arrow_forward
- Hayfever Farms is an 80‑acre hay farm in Colorado. Due to the legalization of marijuana production in the state, the owners are considering changing the farm's name to Blissful Acres and growing marijuana instead of hay. Use the information presented in the table to answer three questions. Number of acres MC $ MR $ (hay) MR $ (marijuana) 10 320 730 5,600 20 200 730 5,600 30 540 730 5,600 40 730 730 5,600 50 1,200 730 5,600 60 3,200 730 5,600 70 5,600 730 5,600 80 6,700 730 5,600 If they continue to grow only hay, how many acres should Hayfever Farms devote to growing hay in order to maximize profits? area devoted to hay:_______ acres If the owners decide to only grow marijuana, how many acres should Blissful Acres devote to growing marijuana in order to maximize profits? area devoted to marijuana:_______ acres Which outcome likely happens due to the legalization of marijuana production and consumption? The number of growers…arrow_forwardThe market for superpremium ice creams is dominated by Ben&Jerry's and Haagen-Dazs, which compete with non-overlapping flavors and a "chunky" vs. "smooth" concept, depending on the presence of mix-ins (mix-ins are extra ingredients like chocolate, caramel, candy, and baked goods that have been added to the ice cream). Using a unit segment to represent smoothness of the ice cream, Haagen-Dazs (A) produces perfectly smooth flavors (i.e. is located at 0), while Ben&Jerry's (B) produces perfectly chunky flavors (i.e. is located at 1). Ice cream consumers differ in their preference for smoothness and are uniformly distributed along the segment. Each consumer has a disutility (in addition to the price) from departing from their favorite smoothness, equal to a unit transport cost of t = 2. Both firms have the same marginal cost c = 10 and no fixed costs. 1. Write the total cost of buying from A and B for a consumer located at z. 2. Find the marginal consumer and derive demand for the two…arrow_forwardProduct Quality Value for Money Ease of use 0.8 0.6 0.7 21 0.2 0.5 0.8 3. 0.6 0.3 0.5 4 (Proposed) 0.4 0.7 0.1 Importance weight I 1.6 A company conducted a survey of shoppers to understand customer buying habits and determine the share of shoppers that a new product might attract. The customer rated three existing products and one proposed new product on three dimensions: 1.Quality, 2. Durability, and 3. Ease of use. The results of this survey are shown in the following table. The expected market share for the new proposed product (product number 4) is: (2.0) A. 46.3 В. 25.2 C. 15.1 D. 11.6 20.0 E.arrow_forward
- The management of a certain company would like to use the following data to learn about its customer base and to evaluate the first day promotional campaign purchases. Customers who made purchases with discount coupons were labelled as “Promotional Customers”, and “Regular Customers” was used for those who did not use coupons. Customer Type of Customer Items Net Sales (GH¢) Method of Payment Gender Marital Status Age 1 Regular 1 100 Vodacash Male Married 32 2 Promotional 1 105 MTN mobile money Female Single 36 3 Regular 1 230 Airtel money Female Married 32 4 Promotional 5 300 MTN mobile money Male Married 28 5 Regular 2 150 Vodacash Female Single 34 6 Regular 20 450 Vodacash Female Married 44 7 Promotional 2 78 MTN mobile money Male Married 30 8 Promotional 3 120 MTN mobile money Female Single 22 9 Promotional 6 345…arrow_forwardThe Kalamazoo Brewing Company (KBC) currently sells its microbrews in a seven-state area: Illinois, Indiana,Michigan, Minnesota, Mississippi, Ohio, and Wisconsin. The company’s data analytics department has collecteddata from its distributors in each state. This data consists of the quantity of cases and price (per case) ofmicrobrews sold in each state, as well as the average income (in thousands of dollars) of consumers living invarious regions of each state. The data for each state are available in the Excel file on Brightspace--please notethere are multiple tabs at the bottom of the spreadsheet, each refers to one of the seven states selling theKalamazoo Brewing Company’s microbrews. You will use the data to estimate the linear demand function fortheir microbrews in Indiana. To do this, perform the regression analysis in Excel for the data provided forIndiana.a. Write out the estimated linear demand function for microbrews in Indiana as a function of the price percase (P) and…arrow_forwardThe last digit of the heights of 67 statistics students were obtained as part of an experiment conducted for a class. Use the following frequency distribution to construct a histogram. What can be concluded from the distribution of the digits? Specifically, do the heights appear to be reported or actually measured? Digit Frequency 0 15 5 5 1 T Choose the correct histogram below. O A. O B. O C. D. 18- 56789 0123456789 ܩܫܠ 6789 123456789 Are the data reported or measured? O A. The data appears to be measured. The heights occur with roughly the same frequency. O B. The data appears to be measured. Certain heights occur a ..arrow_forward
- A retail store wants to categorize its customers based on their shopping behaviour without pre- defining any categories, which Data mining method will they usearrow_forward18. Car and Taxi Ages When the author visited Dublin, Ireland (home of Guinness Breweryemployee William Gosset, who first developed the t distribution), he recorded the ages of randomlyselected passenger cars and randomly selected taxis. The ages can be found from thelicense plates. (There is no end to the fun of traveling with the author.) The ages (in years) arelisted below. We might expect that taxis would be newer, so test the claim that the mean age ofcars is greater than the mean age of taxis.arrow_forwardQ. Please draw a graph as indicated in the problem and answer the question The data presented in Table were published in the March 1, 1984, issue of The Wall Street Journal. They relate to the advertising budget (in millions of dollars) of 21 firms for 1983 and millions of impressions were retained per week by the viewers of the products of these firms. The data are based on a survey of 4000 adults in which users of the products were asked to cite a commercial they had seen for the product category in the past week. a. Plot impressions on the vertical axis and advertising expenditure on the horizontal axis. b. What can you say about the nature of the relationship between the two variables? c. Looking at your graph, do you think it pays to advertise? Think about all those commercials shown on Super Bowl Sunday or during the World Series. Please provide an explanation in detail as well.arrow_forward
arrow_back_ios
SEE MORE QUESTIONS
arrow_forward_ios
Recommended textbooks for you

 Principles of Economics (12th Edition)EconomicsISBN:9780134078779Author:Karl E. Case, Ray C. Fair, Sharon E. OsterPublisher:PEARSON
 Engineering Economy (17th Edition)EconomicsISBN:9780134870069Author:William G. Sullivan, Elin M. Wicks, C. Patrick KoellingPublisher:PEARSON
 Principles of Economics (MindTap Course List)EconomicsISBN:9781305585126Author:N. Gregory MankiwPublisher:Cengage Learning
 Managerial Economics: A Problem Solving ApproachEconomicsISBN:9781337106665Author:Luke M. Froeb, Brian T. McCann, Michael R. Ward, Mike ShorPublisher:Cengage Learning
 Managerial Economics & Business Strategy (Mcgraw-...EconomicsISBN:9781259290619Author:Michael Baye, Jeff PrincePublisher:McGraw-Hill Education
Principles of Economics (12th Edition)
Economics
ISBN:9780134078779
Author:Karl E. Case, Ray C. Fair, Sharon E. Oster
Publisher:PEARSON
Engineering Economy (17th Edition)
Economics
ISBN:9780134870069
Author:William G. Sullivan, Elin M. Wicks, C. Patrick Koelling
Publisher:PEARSON
Principles of Economics (MindTap Course List)
Economics
ISBN:9781305585126
Author:N. Gregory Mankiw
Publisher:Cengage Learning
Managerial Economics: A Problem Solving Approach
Economics
ISBN:9781337106665
Author:Luke M. Froeb, Brian T. McCann, Michael R. Ward, Mike Shor
Publisher:Cengage Learning
Managerial Economics & Business Strategy (Mcgraw-...
Economics
ISBN:9781259290619
Author:Michael Baye, Jeff Prince
Publisher:McGraw-Hill Education
Hypothesis Testing using Confidence Interval Approach; Author: BUM2413 Applied Statistics UMP;https://www.youtube.com/watch?v=Hq1l3e9pLyY;License: Standard YouTube License, CC-BY
Hypothesis Testing - Difference of Two Means - Student's -Distribution & Normal Distribution; Author: The Organic Chemistry Tutor;https://www.youtube.com/watch?v=UcZwyzwWU7o;License: Standard Youtube License