
Total income, net taxes and
Explanation of Solution
Figure 1 represents the circular flow of income in the economy. The information provided in the given case indicates that government expenditure in the economy, shown by 'U' in Figure 1, is $2 trillion. The variable 'W' that reflects consumption expenditure in the economy, is worth $7 trillion.
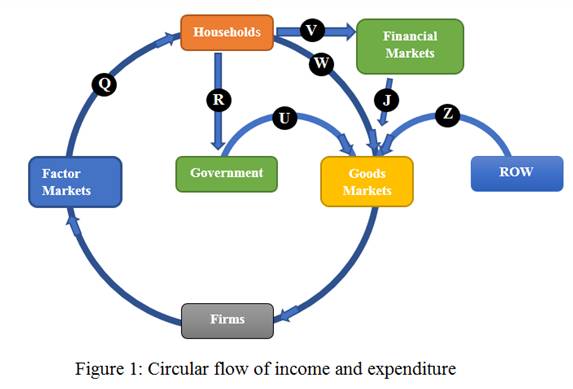
In the similar manner, the flow shown by variable 'J' is the investment expenditure and 'Z' shows the flow of net exports. These expenditures are equal to $1.5 trillion and $0 respectively.
In an economy, the total income is the factor income earned by the factors o9f production. Here, the factor market is paying an income shown by 'Q' in Figure 1. This value is not provided. Hence, use the
Under expenditure method, GDP is computed as the sum of four expenditures:

Here 'C' is the consumption spending, 'I' is the investment spending, 'G' is the spending incurred by the government and 'NX' is the net exports. Data indicates that the value of 'C' is $7 trillion, and that of 'I' is $1.5 trillion. Net exports are worth $0 and 'G' is $2 trillion.
Use the expenditure method to find GDP as well as total income:


Total income as well as GDP is both worth.  trillionNet taxes represent the amount of taxes paid by the household that are subjected to all the cash benefits received by them. In figure 1, this is represented by a flow of variable 'R'. Note that there is no value provide for net taxes. Hence, use the following expression for net taxes:

In this case, 'S' is the saving and is shown by 'V' in figure 1.
The value of 'V' is $1.5 trillion so that saving is $1.5 trillion. Given that 'C' is $7 trillion and 'Y' is found to be $10.5 trillion. Use these values to find net taxes:


Hence, net taxes are worth$2 trillion.
Concept Introduction:
Circular flow of income is a tool that is used to represents the flow of real and monetary variables among various sectors in the economy. The nation has four major market participants in the form of firms, households, financial institutions and the government. The flow of goods and services is in the opposite direction to the flow of money.
Want to see more full solutions like this?
Chapter 21 Solutions
EBK FOUNDATIONS OF ECONOMICS

- Suppose that the economy has consumption $90, investment $50, government purchases $30, imports $20, and exports $50. The economy's GDP isarrow_forwardSuppose a government collects $12 billion in various tax revenues and pays $2.5 billion in debt interest, $9 billion in social security benefits and $0.5 billion in government employee wages. What is the direct contribution to GDP coming from this government's fiscal actions? a. $3.0 billion. b. $0.5 billion. C. $11.5 billion. d. $2.5 billion. e. $12.0 billion.arrow_forwardThe following table shows data on personal consumption expenditures, gross private domestic investment, exports, imports, and government consumption expenditures and gross investment for the United States in 2007, as published by the Bureau of Economic Analysis. All figures are in billions of dollars. Fill in the missing cells in the following table to calculate GDP. Components Personal Consumption Expenditures (CC) $9,734.2 Gross Private Domestic Investment (II) $2,125.4 Exports (XX) $1,643 Imports (MM) $2,351 Net exports of goods and services (X−MX−M) Government Consumption Expenditures and Gross Investment (GG) $2,689.8 Gross domestic product (GDP) This method of calculating GDP, which involves summing the , is called the approach.arrow_forward
- The table gives data on the economy of Iberia. Calculate Iberia's GDP. Iberia's GDP is $ billion. Item Net taxes Government expenditure on goods and services Saving Consumption expenditure Investment Exports of goods and services (billions of dollars) 10 20 15 65 18 35arrow_forwardRefer to the following table when answering the following questions. Table 2.2: U.S. 2014-2015 Domestic Income ($ billions) Compensation of employees, paid Wages and salaries Supplements to wages and salaries Business taxes Business subsidies Net operating surplus Private enterprises Surplus of government enterprises Depreciation of fixed capital (Source: Bureau of Economic Analysis) $13,219 $17.651 $17.765 Consider Table 2.2. From this data, total GDP in 2014 was about $14.963 2014 $18.527 9,264 7,487 1,777 1,210 57 4,489 4,509 -20 2,745 2015 9,704 7,866 1,838 1,238 57 4,575 4,593 -19 2,831 billion.arrow_forwardUsing the following national income accounting data, compute (a) GDP, (b) NDP, and (c) NI. All figures are in billions. Category Billions Compensation of employees U.S. exports of goods and services Consumption of fixed capital Government purchases Taxes on production and imports Net private domestic investment Transfer payments U.S. imports of goods and services $ 224.2 17.8 11.8 59.4 14.4 52.1 13.9 16.5 Personal taxes 40.5 Net foreign factor income Personal consumption expenditures Statistical discrepancy 2.2 249.1 0.0 Instructions: Round your answers to 1 decimal place. a. GDP = $ 373.7 billion in b. NDP = $ 376.3 billion c. NI = $ 378.5 billionarrow_forward
- The figure shows the flows of expenditure and income on Big Foot Island. In 2016, W was $56 billion; V was $20 billion; U was $15 billion; J was $25 billion; and Z was $2 billion. Calculate total expenditure and total taxes. 1- Total income is $…. billion. 2- Net taxes equal $… billion.arrow_forwardThe table shows some of the items in an economy's National Income and Product Accounts. Calculate national income and disposable personal income. Amount Item (trillions of dollars) What is consumption expenditure as a percentage of disposable personal income? Wages Government expenditure 5.9 1.8 >>> Answer to 1 decimal place. Interest, rent, and profit Consumption expenditure 2.2 National income is $ trillion and disposable personal income is $ trillion. 7.0 Investment 1.6 Disposable personal income is percent of national income. Net exports - 0.3 Indirect taxes less subsidies 0.7 Retained profits Transfer payments 1.4 Consumption expenditure is percent of disposable personal income. 1.1 Personal income taxes 1.2 GNP 10.1 Depreciation 1.2 Enter your answer in each of the answer boxes. MacBook Air DII F12 F11 F10 000 000 888 F9 80 F7 F8 F6 F5 F4 F3 esc F2 F1 & # ! 7 8 1 2 3 4 { P T Y Q W E tab J K F G A S caps lock M + I/ %24 Darrow_forwardWhich of the following would be in GDP expenditure-based in the national income accounts for Canada? Select one: a. The interest payments made to bondholders of a Canadian corporation b. The government builds a new hospital c. A Canadian corporation retains part of its earnings An annual salary of a high school teacher d.arrow_forward
- Which spending category of GDP does each of the following transactions count in? Please enter the letter C, I, G, NX, or N to represent consumption, investment, government spending, net exports, or none. The government paid a total of $30,000 in subsidies to people who had installed solar panels on their homes . Bill spent his $400 social security check on rent and food . Company X produces $5,000 of wine this year but they do not sell it . Your parents pay $8,000 for tuition to UCF . The government pays $1 million to people it hires to collect census dataarrow_forwardThe following data about a hypothetical economy are in billions of dollars. Personal Consumption Expenditures $4,500 Consumption of Fixed Capital 150 Gross Private Domestic Investment 800 Government Purchases 950 Exports 65 Imports 85 Refer to the above data. GDP in this economy is: Multiple Choice $6080 billion. $6230 billion. $6380 billion. $6400 billion.arrow_forwardAdam's Ribs in downtown Chicago buys $10,000 worth of beef ribs, $25,000 worth of pork ribs, and $8,000 worth of napkins each month. Are these purchases included in the calculation of gross domestic product? Explain your answer.arrow_forward
