Videos
To construct the frequency distribution of the data of Freshman
Answer to Problem 19SLCT
The frequency distribution is:
| Class-Interval | Frequency |
| 50-59 | 2 |
| 60-69 | 12 |
| 70-79 | 11 |
| 80-89 | 3 |
| 90-99 | 4 |
Explanation of Solution
Given:
The data of freshman is as follows:
| SEX | WT SEPT | WT APRIL | BMI SEPT | BMI APRIL |
| M | 72 | 59 | 22.02 | 18.14 |
| M | 97 | 86 | 19.7 | 17.44 |
| M | 74 | 69 | 24.09 | 22.43 |
| M | 93 | 88 | 26.97 | 25.57 |
| F | 68 | 64 | 21.51 | 20.1 |
| M | 59 | 55 | 18.69 | 17.4 |
| F | 64 | 60 | 24.24 | 22.88 |
| F | 56 | 53 | 21.23 | 20.23 |
| F | 70 | 68 | 30.26 | 29.24 |
| F | 58 | 56 | 21.88 | 21.02 |
| F | 50 | 47 | 17.63 | 16.89 |
| M | 71 | 69 | 24.57 | 23.85 |
| M | 67 | 66 | 20.68 | 20.15 |
| F | 56 | 55 | 20.97 | 20.36 |
| F | 70 | 68 | 27.3 | 26.73 |
| F | 61 | 60 | 23.3 | 22.88 |
| F | 53 | 52 | 19.48 | 19.24 |
| M | 92 | 92 | 24.74 | 24.69 |
| F | 57 | 58 | 20.69 | 20.79 |
| M | 67 | 67 | 20.49 | 20.6 |
| F | 58 | 58 | 21.09 | 21.24 |
| F | 49 | 50 | 18.37 | 18.53 |
| M | 68 | 68 | 22.4 | 22.61 |
| F | 69 | 69 | 28.17 | 28.43 |
| M | 87 | 88 | 23.6 | 23.81 |
| M | 81 | 82 | 26.52 | 26.78 |
| M | 60 | 61 | 18.89 | 19.27 |
| F | 52 | 53 | 19.31 | 19.75 |
| M | 70 | 71 | 20.96 | 21.32 |
| F | 63 | 64 | 21.78 | 22.22 |
| F | 56 | 57 | 19.78 | 20.23 |
| M | 68 | 69 | 22.4 | 22.82 |
| M | 68 | 69 | 22.76 | 23.19 |
| F | 54 | 56 | 20.15 | 20.69 |
| M | 80 | 82 | 22.14 | 22.57 |
| M | 64 | 66 | 20.27 | 20.76 |
| F | 57 | 59 | 22.15 | 22.93 |
| F | 63 | 65 | 23.87 | 24.67 |
| F | 54 | 56 | 18.61 | 19.34 |
| F | 56 | 58 | 21.73 | 22.58 |
| M | 54 | 56 | 18.93 | 19.72 |
| M | 73 | 75 | 25.88 | 26.72 |
| M | 77 | 79 | 28.59 | 29.53 |
| F | 63 | 66 | 21.89 | 22.79 |
| F | 51 | 54 | 18.31 | 19.28 |
| F | 59 | 62 | 19.64 | 20.63 |
| F | 65 | 68 | 23.02 | 24.1 |
| F | 53 | 56 | 20.63 | 21.91 |
| F | 62 | 65 | 22.61 | 23.81 |
| F | 55 | 58 | 22.03 | 23.42 |
| M | 74 | 77 | 20.31 | 21.34 |
| M | 74 | 78 | 20.31 | 21.36 |
| M | 64 | 68 | 19.59 | 20.77 |
| M | 64 | 68 | 21.05 | 22.31 |
| F | 57 | 61 | 23.47 | 25.11 |
| F | 64 | 68 | 22.84 | 24.29 |
| F | 60 | 64 | 19.5 | 20.9 |
| M | 64 | 68 | 18.51 | 19.83 |
| M | 66 | 71 | 21.4 | 22.97 |
| F | 52 | 57 | 17.72 | 19.42 |
| M | 71 | 77 | 22.26 | 23.87 |
| F | 55 | 60 | 21.64 | 23.81 |
| M | 65 | 71 | 22.51 | 24.45 |
| M | 75 | 82 | 23.69 | 25.8 |
| F | 42 | 49 | 15.08 | 17.74 |
| M | 74 | 82 | 22.64 | 25.33 |
| M | 94 | 105 | 36.57 | 40.86 |
Formula used:
COUNTIFS(criteria_range1, criteria1, [criteria_range2, criteria2]…)
Calculation:
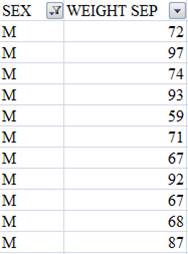
Import the data of SEX and WEIGHT SEP from the provided data set then apply filter to the data. Data of male and female is provided.
Copy the data of male shown in screen shot:
Make the class interval starting from
| Class-Interval |
| 50-59 |
| 60-69 |
| 70-79 |
| 80-89 |
| 90-99 |
Applying the

This is the formula for first class interval and in all the class intervals apply the same formula only values of
| Class-Interval | Frequency |
| 50-59 | 2 |
| 60-69 | 12 |
| 70-79 | 11 |
| 80-89 | 3 |
| 90-99 | 4 |
According to the above created table the data is approximately
Want to see more full solutions like this?
Chapter 2 Solutions
MyLab Statistics with Pearson eText -- Standalone Access Card -- for Biostatistics for the Biological and Health Sciences (My Stat Lab)


 Glencoe Algebra 1, Student Edition, 9780079039897...AlgebraISBN:9780079039897Author:CarterPublisher:McGraw Hill
 Big Ideas Math A Bridge To Success Algebra 1: Stu...AlgebraISBN:9781680331141Author:HOUGHTON MIFFLIN HARCOURTPublisher:Houghton Mifflin Harcourt
 Holt Mcdougal Larson Pre-algebra: Student Edition...AlgebraISBN:9780547587776Author:HOLT MCDOUGALPublisher:HOLT MCDOUGAL