
Country which has unequal distribution of income-Australia or the United States.
Explanation of Solution
Here, as given the below table shows that the distribution of market income in Australia.
Table: 1
| Households | Market income (%) |
| Lowest 20% | 1 |
| Second 20% | 3 |
| Third 20% | 15 |
| Fourth 20% | 26 |
| Highest 20% | 55 |
Here, two sectors of the economy are Household and Business. Household sector owns all factors of production like land, labor and capital. These factors are required for production, which is carried out by business sector. Business sector has to pay price for getting these factors. Landowner will get rent, labor will receive wages and interest is paid to the owner of capital. Sum of the earnings from factors is known as household's market income.
Thus, household's income is the amount that he receives in a given period from factors.
In a country, the distribution of income is the important point. It indicates what percentage of income is flowing to a specific percentage of the total household. Total population is divided into few equal sized groups in ascending order from low income to high income. If total household is divided into five equal groups, then it is known as quintiles.
Then, in quintiles, each group consists of 20 percent of the total households. Considering market income percent of each group, income distribution table of an economy is formed.
Considering the market distribution of income in Australia as given in table 1 in the problem following cumulative distribution of income can be shown-
Cumulative Market Income distribution table of Australia:
| Groups | Percentage of | Cumulative percentage of | ||
| Households | Income | Households | Income | |
| A | Lowest 20% | 1 | 20% | 1 |
| B | Second 20% | 3 | 40% | 4 |
| C | Third 20% | 15 | 60% | 19 |
| D | Fourth 20% | 26 | 80% | 45 |
| E | Highest 20% | 55 | 100% | 100 |
In the above table: 2, entire households have been divided into five equal groups A to E. Each group consists of 20 percent of total households. There market income figures are taken from table 1.
Cumulative is the summation of all figures of the group and earlier groups. For group A, cumulative percentages and table: 2 figures are same since no other groups are available before group A. Cumulative figures of group B is the summation of percentage of group B and its earlier group A. Then, cumulative percentage of households is
In this manner, cumulative percentage of group C households is
Lorenz curve is a diagram, which reflects unequal distribution pattern of market income in an economy. The diagram is drawn below:
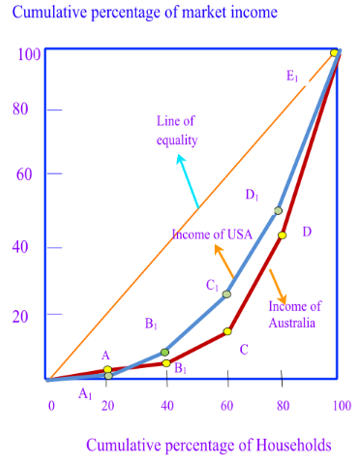
In the diagram, X-axis shows cumulative percentage of households and Y-axis measures the percentage of market income. Red curve is the actual percentage of income flowing to different subsections of people. Straight line is the curve when distribution is equal. Suppose 20% of total population receives exactly 20% of total income, then the distribution is equal. It will lie on a point of the linear curve. Hence, deviation of actual distribution line from equal distribution line will indicate level of unequal distribution. More the actual line deviates from linear line, more will be the level of unequal distribution.
Inequality of the distribution pattern of income in Australia and United states can be compared by drawing Lorenz curve of the two countries. In order to draw Lorenz curve of United States following data of the table are considered. The data below is the market income distribution of United States.
Cumulative Market income distribution table of United States:
| Groups | Percentage of | Cumulative percentage of | ||
| Households | Income | Households | Income | |
| A1 | Lowest 20% | 0.9 | 20% | 0.9 |
| B1 | Second 20% | 7.1 | 40% | 8.0 |
| C1 | Third 20% | 14.3 | 60% | 22.3 |
| D1 | Fourth 20% | 24.4 | 80% | 46.7 |
| E1 | Highest 20% | 53.3 | 100% | 100 |
Above data has been used to draw Lorenz curve of United States in the diagram above by a blue curve.
In the diagram, blue curve is closer to the straight line than red curve. Then, inequality in income distribution in United States is less than the inequality in income distribution at Australia.
Concept Introduction:
When there is huge difference between wealth of people living in a country, thereby leading to difference in living standard, is considered as inequality.
Want to see more full solutions like this?
Chapter 20 Solutions
EBK FOUNDATIONS OF ECONOMICS


 Economics (MindTap Course List)EconomicsISBN:9781337617383Author:Roger A. ArnoldPublisher:Cengage Learning
 Economics: Private and Public Choice (MindTap Cou...EconomicsISBN:9781305506725Author:James D. Gwartney, Richard L. Stroup, Russell S. Sobel, David A. MacphersonPublisher:Cengage Learning