
Videos
For this problem, use the following payoff table:

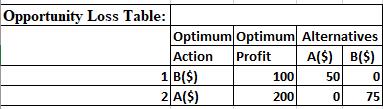
a. Construct an opportunity loss table.
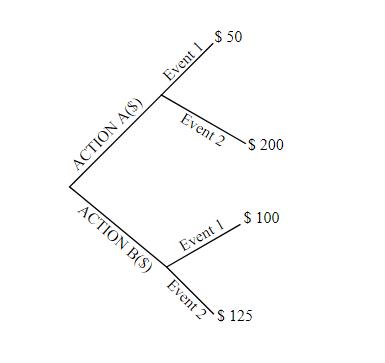
b. Construct a decision tree.
a.
Make an opportunity table using the given payoff table.
Explanation of Solution
The payoff table is given.
Use Excel to construct an opportunity loss table.
Software procedure:
The step-by-step procedure to make an opportunity loss table is given below.
Select Add-Ins > PHStat > Decision-Making > Opportunity Loss.
In the opportunity loss dialog, fill Number of Events as 2 and Number of Alternative Actions as 2.
Click OK.
In the template generated by Excel, fill the payoff table as given in the problem.
The excel output for opportunity loss table is shown below.
b.
Construct a decision tree for the given payoff table.
Explanation of Solution
The tree diagram for the given payoff table is given below.
Want to see more full solutions like this?
Chapter 20 Solutions
Student Solutions Manual for Basic Business Statistics


- Purchasing magazine reported the results of a survey in which buyers were asked aseries of questions with regard to internet usage. One question asked was how theywould use the internet if security and other issues could be resolved. Seventy-eightpercent said they would use it for pricing information, 75% said they would use itto send purchase orders, and 70% said they would use it for purchase orderacknowledgments. Assume that these percentages hold true for all buyers. Aresearcher randomly samples 20 buyers and asked them how they would use theinternet if security and other issues could be resolved. What is the probability thatfewer than 12 would use the internet for purchase orders acknowledgments?arrow_forwardHow do college professors spend their time? The National Education Association Almanac of Higher Education gives the following average distribution of professional time allocation: teaching, 44%; research, 15%; professional growth, 9%; community service, 11%; service to the college, 11%; and consulting outside the college, 10%. Make a pie chart showing the allocation of professional time for college professors. (choose one of the options)arrow_forwardHow do college professors spend their time? The National Education Association Almanac of Higher Education gives the following average distribution of professional time allocation: teaching, 48%; research, 15%; professional growth, 7%; community service, 11%; service to the college, 11%; and consulting outside the college, 8%. Make a pie chart showing the allocation of professional time for college professors.arrow_forward
- Mrs Moore is a agriculturalist and would like to drill for water on her farm. She needs water for irrigation and estimates the benefits of having a successful borehole as $2.0m. However, there is only a 10% chance that she will strike water if she drills and the cost of drilling is $100 000. The alternative is not to drill at all, in which case the benefit will be zero. Draw a decision tree to represent the problem. Should Mrs Moore go ahead and drill? There is another agriculturalist in a nearby state who claims to have supernatural powers to indicate underground water sources. However, he charges a fee and also travel cost. What is the most Mrs Moore should pay for the services? Before Mrs Moore drills, she could also consult a geologist who can assess the promise of the piece of land. He can tell her whether the prospects are “good” or “poor.” But he is not a perfect predictor. If there is water, the conditional probability is 0,95 that he will say that prospects are good. If…arrow_forwardWhen 20 employees were first hired in 2011 for a creative engineering firm, Company A, the starting annual salary was $35,000. A competing creative engineering firm, Company B, had the same starting salary for 20 employees hired the same year. In 2016, data was collected on the annual salaries of the same employees at each of the two companyies. This data is displayed in the box plot shown. Part A: Compare the annual salary distributions and what are the pros and cons of working at each company? Explain using what you found in Part Aarrow_forwardNew representatives for the John Ford Metal and Wheel Company attend a brief training program before being assigned to a regional office. At the end of such a program, each representative was ranked with respect to future sales potential. At the end of the first sales year, their rankings were paired with their annual sales: 2. 3. 4. 6. 7. 8. 9. 10. a. b. C. Representative Kitchen Bond Gross Arbuckle Greene Arden Crane Arthur Keene Knopf Annual Sales ($000) 319 150 175 460 348 300 280 200 190 300 Ranking in Training Program 4 9 6 1 3 B15278 10 Compute Spearman's rank correlation coefficient. Interpret. Do a hypothesis test at the .01 level of significance.arrow_forward
- Otitis media, or middle ear infection, is initially treated with an antibiotic. Researchers have compared two antibiotics, A and B, for their cost effectiveness. A is inexpensive, safe, and effective. B is also safe. However, it is considerably more expensive and it is generally more effective. Use the tree diagram to the right (where the costs are estimated as the total cost of medication, office visit, ear check, and hours of lost work) to answer the following. a. Find the expected cost of using each antibiotic to treat a middle ear infection. A tree diagram has a root that splits into 2 branches labeled A and B. Primary branch A splits into 2 secondary branches labeled 0.80 Cure 59.30 dollars and 0.20 No cure 96.15 dollars. Primary branch B splits into two secondary branches labeled 0.90 Cure 69.15 dollars and 0.10 No cure 106.00 dollars.0.800.200.900.10 b. To minimize the total expected cost, which antibiotic should be chosen? a. The expected cost of…arrow_forwardOtitis media, or middle ear infection, is initially treated with an antibiotic. Researchers have compared two antibiotics, A and B, for their cost effectiveness. A is inexpensive, safe, and effective. B is also safe. However, it is considerably more expensive and it is generally more effective. Use the tree diagram to the right (where the costs are estimated as the total cost of medication, office visit, ear check, and hours of lost work) to answer the following. a. Find the expected cost of using each antibiotic to treat a middle ear infection. 0.75 , Cure $59.30 A 0.25 No cure $96.15 0.85, Cure $69.15 No cure $106.00 0.15 b. To minimize the total expected cost, which antibiotic should be chosen? a. The expected cost of using antibiotic A is $ (Round to the nearest cent as needed.)arrow_forwardOtitis media, or middle ear infection, is initially treated with an antibiotic. Researchers have compared two antibiotics, A and B, for their cost effectiveness. A is inexpensive, safe, and effective. B is also safe. However, it is considerably more expensive and it is generally more effective. Use the tree diagram to the right (where the costs are estimated as the total cost of medication, office visit, ear check, and hours of lost work) to answer the following. a. Find the expected cost of using each antibiotic to treat a middle ear infection. b. To minimize the total expected cost, which antibiotic should be chosen? a. The expected cost of using antibiotic A is S (Round to the nearest cent as needed.) D w an example Get more help ww O Search e ( *** O 19 'C Clear all 0.70 Cure $59.30 A 0.30 No cure $96.15 0.85, Care $69.15 B 0.15 No cure $106.00 Check answer 2:17 PM 12/15/2022arrow_forward
- A friend who lives in Los Angeles makes frequent consultingtrips to Washington, D.C.; 50% of the time shetravels on airline #1, 30% of the time on airline #2, and the remaining 20% of the time on airline #3. For airline#1, flights are late into D.C. 30% of the time and late intoL.A. 10% of the time. For airline #2, these percentagesare 25% and 20%, whereas for airline #3 the percentagesare 40% and 25%. If we learn that on a particular trip shearrived late at exactly one of the two destinations, whatare the posterior probabilities of having flown on airlines#1, #2, and #3? Assume that the chance of a late arrival inL.A. is unaffected by what happens on the flight to D.C.[Hint: From the tip of each first-generation branch on atree diagram, draw three second-generation brancheslabeled, respectively, 0 late, 1 late, and 2 late.]arrow_forwardSet your utility for $0 to be 0 and $1 million to be 100. Apply the simple decision tree used in determining your utility for money, where the lottery has a prize of $1 million if you win and $0 if you lose, to determine your utility for $500,000 and $200,000. Use these 4 utilities to draw your utility curve for money.arrow_forwardIn 2011 home prices and mortgage rates dropped so low that in a number of cities the monthly cost of owning a home was less expensive than renting. The following data show the average asking rent for 10 markets and the monthly mortgage on the median priced home (including taxes and insurance) for 10 cities where the average monthly mortgage payment was less than the average asking rent (The Wall Street Journal, November 26–27, 2011).Click on the datafile logo to reference the data. Enter negative values as negative numbers. a. Develop the estimated regression equation that can be used to predict the monthly mortgage given the average asking rent (to 2 decimals).The regression equation is:Mortgage ($) = + Rent ($)arrow_forward
 Glencoe Algebra 1, Student Edition, 9780079039897...AlgebraISBN:9780079039897Author:CarterPublisher:McGraw Hill