
Statistics for Business & Economics, Revised (MindTap Course List)
12th Edition
ISBN: 9781285846323
Author: David R. Anderson, Dennis J. Sweeney, Thomas A. Williams, Jeffrey D. Camm, James J. Cochran
Publisher: South-Western College Pub
expand_more
expand_more
format_list_bulleted
Concept explainers
Videos
Textbook Question
Chapter 2, Problem 58SE
A zoo has categorized its visitors into three categories: member, school, and general. The member category refers to visitors who pay an annual fee to support the zoo. Members receive certain benefits such as discounts on merchandise and trips planned by the zoo. The school category includes faculty and students from day care and elementary and secondary schools; these visitors generally receive a discounted rate. The general category includes all other visitors. The zoo has been concerned about a recent drop in attendance. To help better understand attendance and membership, a zoo staff member has collected the following data:
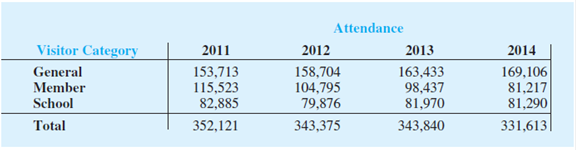
- a. Construct a bar chart of total attendance over time. Comment on any trend in the data.
- b. Construct a side-by-side bar chart showing attendance by visitor category with year as the variable on the horizontal axis.
- c. Comment on what is happening to zoo attendance based on the charts from parts (a) and (b).
Expert Solution & Answer

Trending nowThis is a popular solution!

Students have asked these similar questions
3. A zoo has categorized its visitors into three categories: member, school, and general.
The member category refers to visitors who pay an annual fee to support the zoo.
Members receive certain benefits such as discounts on merchandise and tips planned by
the zoo. The school category includes faculty and students from day care and
elementary and secondary schools; these visitors generally receive a discounted rate.
The general category includes all other visitors. The zoo has been concerned about a
recent drop in attendance. To help better understand attendance and membership, a
zoo staff member has collected the following data:
Visitor Category
General
Member
School
Total
Year 1
Year 2
Year 3
Year 4
153,713
158,704
163,433
169,106
115,523
104,795
98,437
81,217
82,885
79,876
81,970
81,290
352,121
343,375
343,840
331,613
a) Construct a bar chart of total attendance over time. Comment on any trend in the data.
b) Construct a side-by side bar chart showing by visitor category with year…
Compare and contrast the three types of responsibility centers. What is the best way to evaluate a manager's performance in each type of center? What is the problem with using only financial measures of performance?
The monthly cost for health care for an employee and two dependents in a certain year is given in the following table.
Provider
Cost
Provider
Cost
Maxicare
$415.31
Kaiser
$4337
Cigna
$424.74
Aetna
$436.26
Health Net
$427.29
Blue Shield
$442.25
Pacific Care
$428.06
Omni Healthcare
$457.90
Redwoods Plan
$431.53
Lifeguard
$457.64
Draw a box plot for the monthly costs of health care (ranked from lowest to highest).
0415
420
425
430
435
440
0425
430
435
440
445
450
455
420
430
440
450
420
430
440
450
Chapter 2 Solutions
Statistics for Business & Economics, Revised (MindTap Course List)
Ch. 2.1 - Methods 1. The response to a question has three...Ch. 2.1 - A partial relative frequency distribution is...Ch. 2.1 - A questionnaire provides 58 Yes, 42 No, and 20...Ch. 2.1 - for the 20102011 viewing season, the top five...Ch. 2.1 - In alphabetical order, the six most common last...Ch. 2.1 - Nielsen Media Research provided the list of the 25...Ch. 2.1 - The Canmark Research Center Airport Customer...Ch. 2.1 - Data for a sample of 55 members of the Baseball...Ch. 2.1 - The Pew Research Centers Social Demographic...Ch. 2.1 - The Financial Times/Harris Poll is a monthly...
Ch. 2.2 - Consider the following data. a. Develop a...Ch. 2.2 - Consider the following frequency distribution....Ch. 2.2 - Construct a histogram for the data in exercise 12.Ch. 2.2 - Consider the following data. a. Construct a dot...Ch. 2.2 - Construct a stem-and-leaf display for the...Ch. 2.2 - Construct a stem-and-leaf display for the...Ch. 2.2 - Applications A doctors office staff studied the...Ch. 2.2 - A shortage of candidates has required school...Ch. 2.2 - The London School of Economics and the Harvard...Ch. 2.2 - Fortune provides a list of Americas largest...Ch. 2.2 - entrepreneur magazine ranks franchises using...Ch. 2.2 - The Nielsen Home Technology Report provided...Ch. 2.2 - Prob. 24ECh. 2.2 - A psychologist developed a new test of adult...Ch. 2.2 - The 2011 Cincinnati Flying Pig Half-Marathon (13.1...Ch. 2.3 - The following data are for 30 observations...Ch. 2.3 - The following observations are for two...Ch. 2.3 - The following crosstabulation shows household...Ch. 2.3 - Refer again to the crosstabulation of household...Ch. 2.3 - Recently, management at Oak Tree Golf Course...Ch. 2.3 - Table 2.12 shows a data set containing information...Ch. 2.3 - Refer to the data in Table 2.12. a. Prepare a...Ch. 2.3 - Refer to the data in Table 2.12. a. Prepare a...Ch. 2.3 - The U.S. Department of Energys Fuel Economy Guide...Ch. 2.4 - The following 20 observations are for two...Ch. 2.4 - Consider the following data on two categorical...Ch. 2.4 - The following crosstabulation summarizes the data...Ch. 2.4 - A study on driving speed (miles per hour) and fuel...Ch. 2.4 - The Current Results website lists the average...Ch. 2.4 - People often wait until middle age to worry about...Ch. 2.4 - Smartphones are advanced mobile phones with...Ch. 2.4 - The Northwest regional manager of an outdoor...Ch. 2 - Approximately 1.5 million high school students...Ch. 2 - The Pittsburgh Steelers defeated the Arizona...Ch. 2 - Data showing the population by state in millions...Ch. 2 - A startup companys ability to gain funding is a...Ch. 2 - Consumer complaints are frequently reported to the...Ch. 2 - Dividend yield is the annual dividend paid by a...Ch. 2 - One of the questions in a Financial Times/Harris...Ch. 2 - western University has only one womens softball...Ch. 2 - A survey of commercial buildings served by the...Ch. 2 - Table 2.18 shows a portion of the data for a...Ch. 2 - Refer to the data set in Table 2.18. a. Construct...Ch. 2 - Refer to the data set in Table 2.18. a. Construct...Ch. 2 - Refer to the data set in Table 2.18. a. Prepare a...Ch. 2 - Google has changed its strategy with regard to how...Ch. 2 - A zoo has categorized its visitors into three...Ch. 2 - Pelican Stores Pelican Stores, a division of...Ch. 2 - Motion Picture Industry The motion picture...
Knowledge Booster


Learn more about
Need a deep-dive on the concept behind this application? Look no further. Learn more about this topic, statistics and related others by exploring similar questions and additional content below.Similar questions
- A company makes parts that cost $35.00 in material and labor. 92% of the parts are produced defect free and are sold for full price at $110 each. 2% of the parts made must be scrapped. Scrap parts are sold for $8.00 each. The remaining 6% of the parts made must be reworked at a cost of $12.00 each. After rework 1% still must be scrapped and the other 5% is sold at a discounted price of $90 each. a. Draw the tree diagram showing the quality cost situation. b. Determine the earnings per part. c. Determine the cost of poor quality (COPQ). d. Determine the earnings per part and COPQ if the rework operation was shut down and the parts that required reworking were just sold for scrap instead. Answers- B-70.22 c-4.78 d-66.84, 8.16arrow_forwardThe production level needed from the agricultural sector, the manufacturing sector, and the energy sector is ..... ....... ....... units.arrow_forwardIn 2011, home prices and mortgage rates fell so far that in a number of cities the monthly cost of owning a home was less expensive than renting. The following data show the average asking rent and the monthly mortgage on the median-priced home (including taxes and insurance) for 10 cities where the average monthly mortgage payment was less than the average asking rent (The Wall Street Journal, November 26–27, 2011). 7. City Rent ($) Mortgage ($) Atlanta 840 539 1062 1002 Chicago Detroit 823 626 DATA file Jacksonville, Fla. Las Vegas 779 711 796 655 RentMortgage 1071 953 Miami 977 Minneapolis Orlando, Fla. 776 851 695 762 651 654 Phoenix St. Louis 723 Develop a scatter diagram for these data, treating the average asking rent as the inde- pendent variable. Does a simple linear regression model appear to be appropriate? b. Use a simple linear regression model to develop an estimated regression equation to predict the monthly mortgage on the median-priced home given the average asking…arrow_forward
- Analyze the following situation and determine which decision would be the best decision to make. Explain your answer. A man and his spouse are expecting a baby. Their current health insurance costs $111 per month, but doesn't cover prenatal care or delivery. They can upgrade to a policy that will cover their prenatal care and delivery, but their new premium will be $294 per month. The cost of prenatal care and delivery is approximately $4000. Select the correct choice below and fill in any answer boxes within your choice. O A. They should keep their current policy because it costs $ for nine months, which is significantly less than the upgrade which costs $ for nine months. O B. They should upgrade to the new policy because the current policy costs S for nine months, which is significantly more than the upgrade which costs $ for nine months.arrow_forwardUniversity researchers published a working paper. One of the objectives of the study was to determine whether ride-share drivers actually make a profit.arrow_forwardBargain Rental Car wants to better understand the variable and fixed portions of its car washing costs. The company operates its own car wash facility that cleans each rental car before releasing it to another customer. Management believes the variable portion of its car washing costs relates to the number of rental returns. Accordingly, the following data have been compiled: Month January February March April May June July August September October November December Rental Returns 2,400 2,500 2,800 3,100 3,700 5,100 5,600 5,600 Fixed cost per month Variable cost per rental return 4,700 4,100 2,200 2,900 Exercise 5A-2 Part 2 (Algo) Car Wash Costs $ 11,300 $ 13,300 $ 12,100 $ 14,700 $ 16,500 $ 23,900 $ 22,500 $ 22,900 $ 23,100 $ 22,000 $ 11,000 $ 15,300 2. Using least-squares regression, estimate the variable cost per rental return and the monthly fixed cost incurred to wash cars. Note: Round Fixed cost to the nearest whole dollar amount and the Variable cost per unit to 2 decimal…arrow_forward
- According to Zillow.com, the median sale price for homes in January for South Carolina, California, and Virginia over the last three years is given in the table below (measured in $100,000). able South Carolina California Virginia 2018 183 534 98 2019 193 555 94 2020 216 569 85 In South Carolina, realtors take 5.4% of the sale price on average as part of their commission. The average realtor commission rates in California and Virginia are 4.9% and 5.3%, respectively. Use matrix multiplication to find the total earned by realtors from their commissionsarrow_forwardThe following table shows the expenses and income for a local college student. Assume that amounts shown for salaries and wages are after taxes and that 1 month = 4 weeks. Income Expenses Part-time Job: $1100/month Rent: $550/month Student Loans: $8400/year Groceries: $50/week Scholarship: $5700/year Tuition and Fees: $7500/year Health Insurance: $40/month Entertainment: $40/week Phone: $65/month a) What is the student's monthly income? b) What is the student's monthly expenses? c) What is the student's net monthly cash flow?arrow_forwardJoshua is president of an accounting firm that has 10 employees. The only employee benefit provided by the firm is a paid two-week vacation for employees with one or more year of service. The firm’s profits have substantially increased, and Joshua would like to provide some additional benefits to the employees. Joshua needs advice concerning the types of benefits to provide. Joshua would like to provide health insurance benefits to the employees. What are the major types of Managed Care Plans that he might consider. Tip: HMO, PPO, and POS should be explainedarrow_forward
- The asking price (in thousands of dollars) of some four-bedroom homes in a certain city are described by the dotplot. Asking Prices of Four-Bedroom Homes .. 50 100 150 200 250 300 350 400 450 Thousands of dollars Complete parts (a) through (e). a. A buyer can afford to pay up to $350 thousand. Assuming sellers will not lower their asking prices, what proportion of the homes can the buyer afford? The proportion of homes that the buyer can afford is 0.939. (Round to the nearest thousandth as needed.) b. What proportion of the homes have asking prices between $150 thousand and $250 thousand? The proportion of homes with asking prices between $150 thousand and $250 thousand is (Round to the nearest thousandth as needed.) c. If there were two outliers, estimate their values. The values of the outliers are thousand and V thousand. d. It turns out that the two homes with asking prices you identified in part (c) also have square footages that are outliers. Why does this make sense? O A. This…arrow_forwardIn 2010, the U.S. Congress passed the historic health care reform bill that will provide some type of coverage for the 32 million Americans currently without health care insurance. Just how widespread is the lack of medical coverage? The media claim that the segments of the population most at risk for disease and thus needing healthcare are women, children, the elderly and the poor. The following tables were generated from the U.S. Census Bureau, Current Population Survey, Annual Social and Economic Supplement (2011). The tables report the number of uninsured (in thousands) by sex, by age, and by household income. Is being insured or not dependent on gender? Fill in the degrees of freedom and p-value in the output below and draw a clear conclusion indicating which gender is more at risk of not being insured if there is a significant difference.arrow_forwardHere are the countries with the five highest estimated costs of software piracy: United States ($9.1 billion), China ($8.7 billion), India ($2.7 billion), France ($2.1 billion), United Kingdom ($1.9 billion). Among these five countries, the United States has 37.1% of the cost of piracy. Is it correct to conclude that the United States has 37.1% of the total cost of piracy for all countries? What do these results tell us about the costs of piracy in the other countries not included here?arrow_forward
arrow_back_ios
SEE MORE QUESTIONS
arrow_forward_ios
Recommended textbooks for you
 MATLAB: An Introduction with ApplicationsStatisticsISBN:9781119256830Author:Amos GilatPublisher:John Wiley & Sons Inc
 Probability and Statistics for Engineering and th...StatisticsISBN:9781305251809Author:Jay L. DevorePublisher:Cengage Learning
 Statistics for The Behavioral Sciences (MindTap C...StatisticsISBN:9781305504912Author:Frederick J Gravetter, Larry B. WallnauPublisher:Cengage Learning
 Elementary Statistics: Picturing the World (7th E...StatisticsISBN:9780134683416Author:Ron Larson, Betsy FarberPublisher:PEARSON
 The Basic Practice of StatisticsStatisticsISBN:9781319042578Author:David S. Moore, William I. Notz, Michael A. FlignerPublisher:W. H. Freeman
 Introduction to the Practice of StatisticsStatisticsISBN:9781319013387Author:David S. Moore, George P. McCabe, Bruce A. CraigPublisher:W. H. Freeman
MATLAB: An Introduction with Applications
Statistics
ISBN:9781119256830
Author:Amos Gilat
Publisher:John Wiley & Sons Inc
Probability and Statistics for Engineering and th...
Statistics
ISBN:9781305251809
Author:Jay L. Devore
Publisher:Cengage Learning
Statistics for The Behavioral Sciences (MindTap C...
Statistics
ISBN:9781305504912
Author:Frederick J Gravetter, Larry B. Wallnau
Publisher:Cengage Learning
Elementary Statistics: Picturing the World (7th E...
Statistics
ISBN:9780134683416
Author:Ron Larson, Betsy Farber
Publisher:PEARSON
The Basic Practice of Statistics
Statistics
ISBN:9781319042578
Author:David S. Moore, William I. Notz, Michael A. Fligner
Publisher:W. H. Freeman
Introduction to the Practice of Statistics
Statistics
ISBN:9781319013387
Author:David S. Moore, George P. McCabe, Bruce A. Craig
Publisher:W. H. Freeman
Use of ALGEBRA in REAL LIFE; Author: Fast and Easy Maths !;https://www.youtube.com/watch?v=9_PbWFpvkDc;License: Standard YouTube License, CC-BY
Compound Interest Formula Explained, Investment, Monthly & Continuously, Word Problems, Algebra; Author: The Organic Chemistry Tutor;https://www.youtube.com/watch?v=P182Abv3fOk;License: Standard YouTube License, CC-BY
Applications of Algebra (Digit, Age, Work, Clock, Mixture and Rate Problems); Author: EngineerProf PH;https://www.youtube.com/watch?v=Y8aJ_wYCS2g;License: Standard YouTube License, CC-BY