
Videos
Zoo Member Types and Attendance. A zoo has categorized its visitors into three categories: member, school, and general. The member category refers to visitors who pay an annual fee to support the zoo. Members receive certain benefits such as discounts on merchandise and trips planned by the zoo. The school category includes faculty and students from day care and elementary and secondary schools; these visitors generally receive a discounted rate. The general category includes all other visitors. The zoo has been concerned about a recent drop in attendance. To help better understand attendance and membership, a zoo staff member has collected the following data:
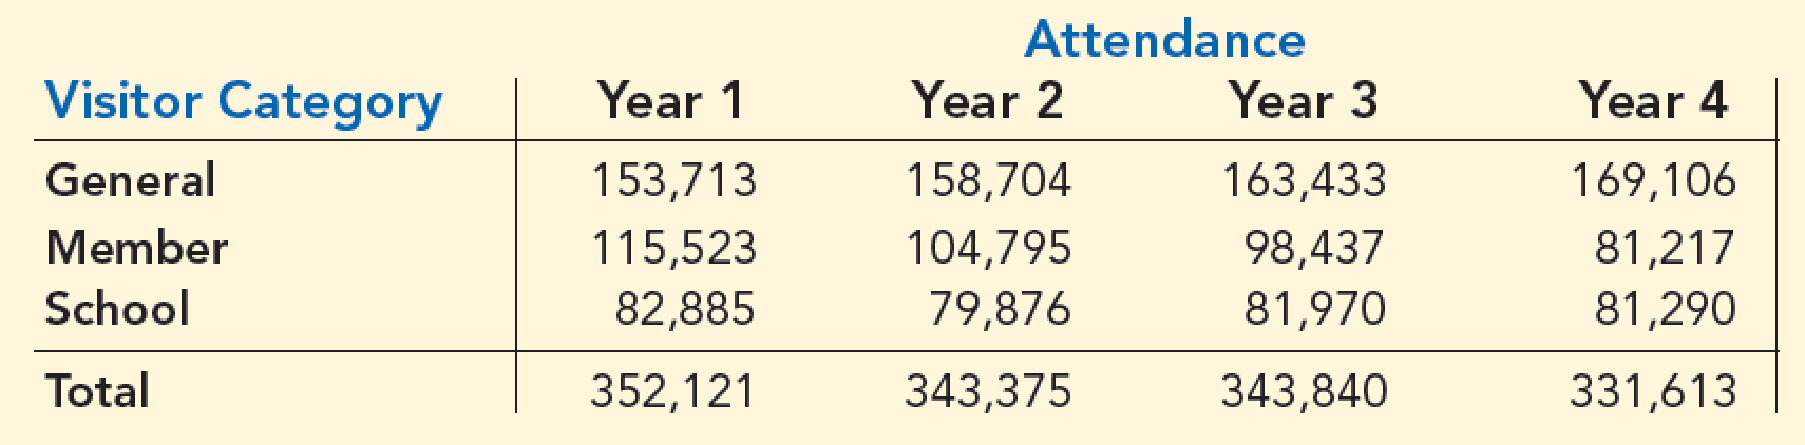
- a. Construct a bar chart of total attendance over time. Comment on any trend in the data.
- b. Construct a side-by-side bar chart showing attendance by visitor category with year as the variable on the horizontal axis.
- c. Comment on what is happening to zoo attendance based on the charts from parts (a) and (b).
Want to see the full answer?
Check out a sample textbook solution
Chapter 2 Solutions
Essentials of Statistics for Business and Economics (with XLSTAT Printed Access Card)


- Compare and contrast the three types of responsibility centers. What is the best way to evaluate a manager's performance in each type of center? What is the problem with using only financial measures of performance?arrow_forwardIn 2011, home prices and mortgage rates fell so far that in a number of cities the monthly cost of owning a home was less expensive than renting. The following data show the average asking rent and the monthly mortgage on the median-priced home (including taxes and insurance) for 10 cities where the average monthly mortgage payment was less than the average asking rent (The Wall Street Journal, November 26–27, 2011). 7. City Rent ($) Mortgage ($) Atlanta 840 539 1062 1002 Chicago Detroit 823 626 DATA file Jacksonville, Fla. Las Vegas 779 711 796 655 RentMortgage 1071 953 Miami 977 Minneapolis Orlando, Fla. 776 851 695 762 651 654 Phoenix St. Louis 723 Develop a scatter diagram for these data, treating the average asking rent as the inde- pendent variable. Does a simple linear regression model appear to be appropriate? b. Use a simple linear regression model to develop an estimated regression equation to predict the monthly mortgage on the median-priced home given the average asking…arrow_forwardThe production level needed from the agricultural sector, the manufacturing sector, and the energy sector is ..... ....... ....... units.arrow_forward
- The Lawson Fabric Mill Produces five different fabrics. Each fabric can be woven on one or more of the mill’s 36 looms. The sales department’s forecast of demand for the next month is shown in below Table 1, along with data on the selling price per yard, variable cost per yard, and purchase price per yard. The mill operates 24 hours a day and is scheduled for 30 days during the coming month. The mill has two types of looms: draw and regular. The draw looms are more versatile and can be used for all five fabrics. The regular looms can produce only three of the fabrics. The mill has a total of 36 looms: 8 are draw and 28 are regular. The rate of production for each fabric on each type of loom is given in below Table 2. The time required to change over from producing one fabric to another is negligible and does not have to be considered. The Lawson Fabric Mill satisfies all demand with either its own fabric or fabric purchased from another mill. Fabrics that cannot be woven at the…arrow_forwardThe asking price (in thousands of dollars) of some four-bedroom homes in a certain city are described by the dotplot. Asking Prices of Four-Bedroom Homes .. 50 100 150 200 250 300 350 400 450 Thousands of dollars Complete parts (a) through (e). a. A buyer can afford to pay up to $350 thousand. Assuming sellers will not lower their asking prices, what proportion of the homes can the buyer afford? The proportion of homes that the buyer can afford is 0.939. (Round to the nearest thousandth as needed.) b. What proportion of the homes have asking prices between $150 thousand and $250 thousand? The proportion of homes with asking prices between $150 thousand and $250 thousand is (Round to the nearest thousandth as needed.) c. If there were two outliers, estimate their values. The values of the outliers are thousand and V thousand. d. It turns out that the two homes with asking prices you identified in part (c) also have square footages that are outliers. Why does this make sense? O A. This…arrow_forwardThe following table shows the expenses and income for a local college student. Assume that amounts shown for salaries and wages are after taxes and that 1 month = 4 weeks. Income Expenses Part-time Job: $1100/month Rent: $550/month Student Loans: $8400/year Groceries: $50/week Scholarship: $5700/year Tuition and Fees: $7500/year Health Insurance: $40/month Entertainment: $40/week Phone: $65/month a) What is the student's monthly income? b) What is the student's monthly expenses? c) What is the student's net monthly cash flow?arrow_forward
- A company makes parts that cost $35.00 in material and labor. 92% of the parts are produced defect free and are sold for full price at $110 each. 2% of the parts made must be scrapped. Scrap parts are sold for $8.00 each. The remaining 6% of the parts made must be reworked at a cost of $12.00 each. After rework 1% still must be scrapped and the other 5% is sold at a discounted price of $90 each. a. Draw the tree diagram showing the quality cost situation. b. Determine the earnings per part. c. Determine the cost of poor quality (COPQ). d. Determine the earnings per part and COPQ if the rework operation was shut down and the parts that required reworking were just sold for scrap instead. Answers- B-70.22 c-4.78 d-66.84, 8.16arrow_forwardAccording to Zillow.com, the median sale price for homes in January for South Carolina, California, and Virginia over the last three years is given in the table below (measured in $100,000). able South Carolina California Virginia 2018 183 534 98 2019 193 555 94 2020 216 569 85 In South Carolina, realtors take 5.4% of the sale price on average as part of their commission. The average realtor commission rates in California and Virginia are 4.9% and 5.3%, respectively. Use matrix multiplication to find the total earned by realtors from their commissionsarrow_forward
 Calculus For The Life SciencesCalculusISBN:9780321964038Author:GREENWELL, Raymond N., RITCHEY, Nathan P., Lial, Margaret L.Publisher:Pearson Addison Wesley,