
Concept explainers
Videos
A zoo has categorized its visitors into three categories: member, school, and general. The member category refers to visitors who pay an annual fee to support the zoo. Members receive certain benefits such as discounts on merchandise and trips planned by the zoo. The school category includes faculty and students from day care and elementary and secondary schools; these visitors generally receive a discounted rate. The general category includes all other visitors. The zoo has been concerned about a recent drop in attendance. To help better understand attendance and membership, a zoo staff member has collected the following data:
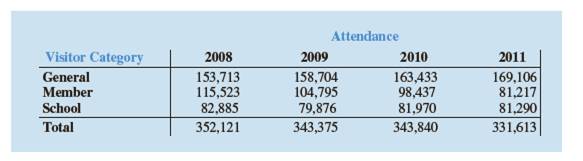
a. Construct a bar chart of total attendance over time. Comment on any trend in the data.
b. Construct a side-by-side bar chart showing attendance by visitor category with year as the variable on the horizontal axis.
c. Comment on what is happening to attendance based on the charts from parts (a) and (b).
Want to see the full answer?
Check out a sample textbook solution
Chapter 2 Solutions
Essentials of Modern Business Statistics with Microsoft Office Excel (Book Only)


- 3. A zoo has categorized its visitors into three categories: member, school, and general. The member category refers to visitors who pay an annual fee to support the zoo. Members receive certain benefits such as discounts on merchandise and tips planned by the zoo. The school category includes faculty and students from day care and elementary and secondary schools; these visitors generally receive a discounted rate. The general category includes all other visitors. The zoo has been concerned about a recent drop in attendance. To help better understand attendance and membership, a zoo staff member has collected the following data: Visitor Category General Member School Total Year 1 Year 2 Year 3 Year 4 153,713 158,704 163,433 169,106 115,523 104,795 98,437 81,217 82,885 79,876 81,970 81,290 352,121 343,375 343,840 331,613 a) Construct a bar chart of total attendance over time. Comment on any trend in the data. b) Construct a side-by side bar chart showing by visitor category with year…arrow_forwardAnalyze the following situation and determine which decision would be the best decision to make. Explain your answer. A man and his spouse are expecting a baby. Their current health insurance costs $111 per month, but doesn't cover prenatal care or delivery. They can upgrade to a policy that will cover their prenatal care and delivery, but their new premium will be $294 per month. The cost of prenatal care and delivery is approximately $4000. Select the correct choice below and fill in any answer boxes within your choice. O A. They should keep their current policy because it costs $ for nine months, which is significantly less than the upgrade which costs $ for nine months. O B. They should upgrade to the new policy because the current policy costs S for nine months, which is significantly more than the upgrade which costs $ for nine months.arrow_forwardThe production level needed from the agricultural sector, the manufacturing sector, and the energy sector is ..... ....... ....... units.arrow_forward
- In 2011, home prices and mortgage rates fell so far that in a number of cities the monthly cost of owning a home was less expensive than renting. The following data show the average asking rent and the monthly mortgage on the median-priced home (including taxes and insurance) for 10 cities where the average monthly mortgage payment was less than the average asking rent (The Wall Street Journal, November 26–27, 2011). 7. City Rent ($) Mortgage ($) Atlanta 840 539 1062 1002 Chicago Detroit 823 626 DATA file Jacksonville, Fla. Las Vegas 779 711 796 655 RentMortgage 1071 953 Miami 977 Minneapolis Orlando, Fla. 776 851 695 762 651 654 Phoenix St. Louis 723 Develop a scatter diagram for these data, treating the average asking rent as the inde- pendent variable. Does a simple linear regression model appear to be appropriate? b. Use a simple linear regression model to develop an estimated regression equation to predict the monthly mortgage on the median-priced home given the average asking…arrow_forwardBargain Rental Car wants to better understand the variable and fixed portions of its car washing costs. The company operates its own car wash facility that cleans each rental car before releasing it to another customer. Management believes the variable portion of its car washing costs relates to the number of rental returns. Accordingly, the following data have been compiled: Month January February March April May June July August September October November December Rental Returns 2,400 2,500 2,800 3,100 3,700 5,100 5,600 5,600 Fixed cost per month Variable cost per rental return 4,700 4,100 2,200 2,900 Exercise 5A-2 Part 2 (Algo) Car Wash Costs $ 11,300 $ 13,300 $ 12,100 $ 14,700 $ 16,500 $ 23,900 $ 22,500 $ 22,900 $ 23,100 $ 22,000 $ 11,000 $ 15,300 2. Using least-squares regression, estimate the variable cost per rental return and the monthly fixed cost incurred to wash cars. Note: Round Fixed cost to the nearest whole dollar amount and the Variable cost per unit to 2 decimal…arrow_forwardUniversity researchers published a working paper. One of the objectives of the study was to determine whether ride-share drivers actually make a profit.arrow_forward
- According to Zillow.com, the median sale price for homes in January for South Carolina, California, and Virginia over the last three years is given in the table below (measured in $100,000). able South Carolina California Virginia 2018 183 534 98 2019 193 555 94 2020 216 569 85 In South Carolina, realtors take 5.4% of the sale price on average as part of their commission. The average realtor commission rates in California and Virginia are 4.9% and 5.3%, respectively. Use matrix multiplication to find the total earned by realtors from their commissionsarrow_forwardThe following table shows the expenses and income for a local college student. Assume that amounts shown for salaries and wages are after taxes and that 1 month = 4 weeks. Income Expenses Part-time Job: $1100/month Rent: $550/month Student Loans: $8400/year Groceries: $50/week Scholarship: $5700/year Tuition and Fees: $7500/year Health Insurance: $40/month Entertainment: $40/week Phone: $65/month a) What is the student's monthly income? b) What is the student's monthly expenses? c) What is the student's net monthly cash flow?arrow_forwardJoshua is president of an accounting firm that has 10 employees. The only employee benefit provided by the firm is a paid two-week vacation for employees with one or more year of service. The firm’s profits have substantially increased, and Joshua would like to provide some additional benefits to the employees. Joshua needs advice concerning the types of benefits to provide. Joshua would like to provide health insurance benefits to the employees. What are the major types of Managed Care Plans that he might consider. Tip: HMO, PPO, and POS should be explainedarrow_forward
- Here are the countries with the five highest estimated costs of software piracy: United States ($9.1 billion), China ($8.7 billion), India ($2.7 billion), France ($2.1 billion), United Kingdom ($1.9 billion). Among these five countries, the United States has 37.1% of the cost of piracy. Is it correct to conclude that the United States has 37.1% of the total cost of piracy for all countries? What do these results tell us about the costs of piracy in the other countries not included here?arrow_forwardInterpret the path diagram below: Critical thinking DNA Statistics Mathematics Conceptual understandingarrow_forwardIn 2010, the U.S. Congress passed the historic health care reform bill that will provide some type of coverage for the 32 million Americans currently without health care insurance. Just how widespread is the lack of medical coverage? The media claim that the segments of the population most at risk for disease and thus needing healthcare are women, children, the elderly and the poor. The following tables were generated from the U.S. Census Bureau, Current Population Survey, Annual Social and Economic Supplement (2011). The tables report the number of uninsured (in thousands) by sex, by age, and by household income. Is being insured or not dependent on gender? Fill in the degrees of freedom and p-value in the output below and draw a clear conclusion indicating which gender is more at risk of not being insured if there is a significant difference.arrow_forward
 MATLAB: An Introduction with ApplicationsStatisticsISBN:9781119256830Author:Amos GilatPublisher:John Wiley & Sons Inc
 Probability and Statistics for Engineering and th...StatisticsISBN:9781305251809Author:Jay L. DevorePublisher:Cengage Learning
 Statistics for The Behavioral Sciences (MindTap C...StatisticsISBN:9781305504912Author:Frederick J Gravetter, Larry B. WallnauPublisher:Cengage Learning
 Elementary Statistics: Picturing the World (7th E...StatisticsISBN:9780134683416Author:Ron Larson, Betsy FarberPublisher:PEARSON
 The Basic Practice of StatisticsStatisticsISBN:9781319042578Author:David S. Moore, William I. Notz, Michael A. FlignerPublisher:W. H. Freeman
 Introduction to the Practice of StatisticsStatisticsISBN:9781319013387Author:David S. Moore, George P. McCabe, Bruce A. CraigPublisher:W. H. Freeman