
Videos
Refer to the Real Estate data, which reports information on homes sold in the Goodyear, Arizona, area during the last year. Select an appropriate class interval and organize the selling prices into a frequency distribution. Write a brief report summarizing your findings. Be sure to answer the following questions in your report.
- a. Around what values do the data tend to cluster?
- b. Based on the frequency distribution, what is the typical selling price in the first class? What is the typical selling price in the last class?
- c. Draw a cumulative frequency distribution. How many homes sold for less than $200,000? Estimate the percent of the homes that sold for more than $220,000. What percent of the homes sold for less than $125,000?
- d. Refer to the variable regarding the townships. Draw a bar chart showing the number of homes sold in each township. Are there any differences or is the number of homes sold about the same in each township?
a.
Find an appropriate class interval.
Create a frequency distribution for the selling prices and explain the results.
Find the values of price that the data tend to cluster.
Answer to Problem 51DE
The data tend to cluster between 180 (in $000) and 250 (in $000).
Explanation of Solution
Here, the data set consists of 105 observations. The value of k can be obtained as follows:
Here,
Therefore, the number of classes for the given data set is 7.
From the real estate data, the minimum and maximum values of selling price are 125 (in $000) and 345.3 (in $000), respectively.
The formula for the class interval is given as follows:
Where, i is the class interval and k is the number of classes.
Therefore, the class interval for the given data can be obtained as follows:
In practice, the class interval size is usually rounded up to some convenient number. Therefore, the reasonable class interval is 35.
Frequency distribution:
Frequency table is a collection of mutually exclusive and exhaustive classes, which shows the number of observations in each class.
Since the minimum value is 125 and the class interval is 35, the first class would be 110-145. Here, the first one is preferred as the first class of the frequency distribution. The frequency distribution for selling price is constructed as follows:
|
Selling price (1,000’s) | Frequency |
Cumulative frequency |
| 110-145 | 3 | 3 |
| 145-180 | 19 | |
| 180-215 | 31 | |
| 215-250 | 25 | |
| 250-285 | 14 | |
| 285-320 | 10 | |
| 320-355 | 3 | |
| Total | 105 |
From the above table, it is clear that maximum values of frequency are obtained for the intervals 180-215 and 215-250. Their corresponding frequencies are 31 and 25, respectively.
That is, 53%
b.
Find the typical selling in the first class.
Find the typical selling in the last class.
Answer to Problem 51DE
The typical selling price of the first class is 127.5 (in $000).
The typical selling price of the last class is 337.5 (in $000).
Explanation of Solution
The lower and upper limits of the first class are 110 and 145, respectively.
The typical selling price of the first class is calculated as follows:
Thus, the typical selling price of the first class is 127.5 (in $000).
The lower and upper limits of the last class are 355 and 320, respectively.
The typical selling price of the last class is calculated as follows:
Thus, the typical selling price of the last class is 337.5 (in $000).
c.
Plot the cumulative frequency distribution.
Find the number of homes sold for less than $200,000.
Find the percent of homes sold for more than $220,000.
Find the percentage of homes sold for less than $125,000.
Answer to Problem 51DE
The plot of the cumulative frequency distribution for the given data is as follows:
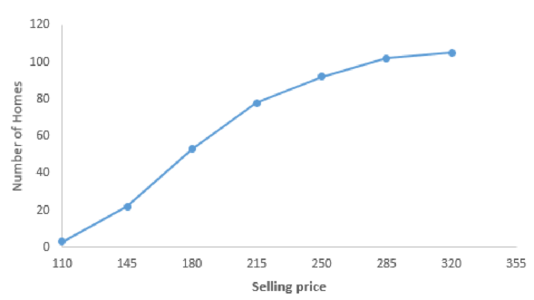
The number of homes sold for less than $200,000 is 42.
The percent of homes sold for more than $200,000 46.7.
The percentage of homes sold for less than $125,000 is 0%.
Explanation of Solution
Step-by-step procedure to obtain the plot using the EXCEL is as follows:
- Select the data range.
- Go to Insert > Charts > line chart.
- Select the Scatter with Straight Lines and Markers under Charts.
Thus, the plot is obtained.
Step-by-step procedure to find the number of homes sold for less than $200,000:
- Select Insert > PivotTable.
- In Table/Range, select the data range.
- Move Selling Price to Rows.
- Again move Selling Price to ∑Values.
- Right click on any data in Row Labels.
- Select Group.
- In Grouping, enter 100 in Starting at, 360 in Ending at, and enter 20 in By.
Output is obtained as follows:
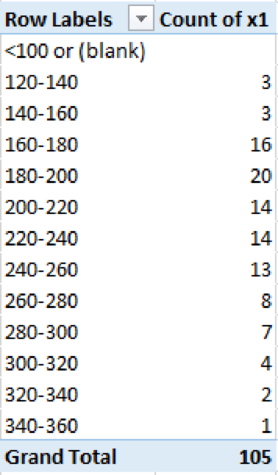
From the above output, the number of homes sold for less than $200,000 is 42
The percent of homes that are sold for more than $220,000 is 46.7%
In the data set, the minimum value is 125. Therefore, no homes are sold for less than $125,000. Therefore, the percentage of homes sold for less than $125,000 is 0%.
d.
Create a bar chart for the number of homes sold in each township.
Explain whether the number of homes sold is about the same in each township.
Answer to Problem 51DE
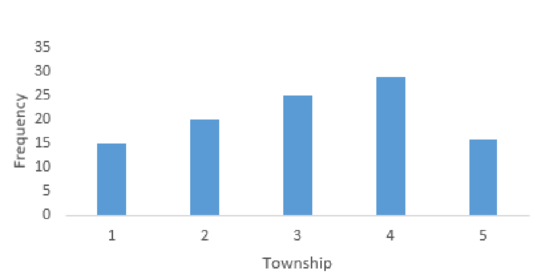
The bar chart that represents the number of homes sold in each township is as follows:
Explanation of Solution
For the variable Township, the frequency table is obtained as follows:
| Township | Frequency |
| 1 | 15 |
| 2 | 20 |
| 3 | 25 |
| 4 | 29 |
| 5 | 16 |
The bar chart for the given data can be drawn using EXCEL.
Step-by-step procedure to obtain the bar chart using EXCEL:
- Enter the column of township along with their frequency column.
- Select the total data range with labels.
- Go to Insert > Charts > bar chart.
- Select the appropriate bar chart.
- Click OK.
Thus, the bar chart is obtained.
From the above bar chart, the highest frequency occurred for townships 3 and 4 and the lowest frequency occurred for townships 1 and 5. Thus, the number of homes sold is not about the same in each township.
Want to see more full solutions like this?
Chapter 2 Solutions
STATISTICAL TECHNIQUES-ACCESS ONLY


 Glencoe Algebra 1, Student Edition, 9780079039897...AlgebraISBN:9780079039897Author:CarterPublisher:McGraw Hill
 Big Ideas Math A Bridge To Success Algebra 1: Stu...AlgebraISBN:9781680331141Author:HOUGHTON MIFFLIN HARCOURTPublisher:Houghton Mifflin Harcourt
 Holt Mcdougal Larson Pre-algebra: Student Edition...AlgebraISBN:9780547587776Author:HOLT MCDOUGALPublisher:HOLT MCDOUGAL