Financial Accounting
3rd Edition
ISBN: 9780133791129
Author: Jane L. Reimers
Publisher: Pearson Higher Ed
expand_more
expand_more
format_list_bulleted
Videos
Textbook Question
Chapter 2, Problem 36EB
Expert Solution & Answer
Want to see the full answer?
Check out a sample textbook solution
Students have asked these similar questions
You are provided with the Income Statement and the Balance Sheet of HTS software, Inc. for 2011.
Required:
(b) Analyze the current financial position for the company from a time series and cross section viewpoint.
(c) Break your analysis into an evaluation of the firm’s liquidity, activity, debt, profitability and market ratios.
Historical and Industry Average Ratios
HTS Software , Inc.
Ratio
2010
2011
Industry2011
Current Ratio
2.6
—
2.7
Quick Ratio
1.8
—
1.75
Inventory Turnover
4.5
—
4.7
Average Collection Period
40days
—
42 days
Total Asset Turnover
1.2
—
1
Debt Ratio
20%
—
21%
Times Interest Earned
9
—
8.9
Gross Profit Margin
43%
—
44%
Operating Profit Margin
30%
—
32%
Net Profit Margin
20%
—
21%
Return on total assets
12%
—
13%
Return on Equity
Price/Earnings Ratio
15%
7.3
—
—
16%
8
Balance SheetHTS Software, Inc.December 31,…
Please select THREE of the ratios listed below and perform them for years 2012 and 2011. Please interpret the data by including the following:
(1) Write out the formula for each ratio you selected and show your calculations.
(2) Discuss whether each ratio you selected measures liquidity or profitability and what those terms mean.
(3) What factor(s) contributed to the increase or decrease from last year? Discuss whether those changes were favorable or unfavorable to the company and why?
(4) What does each of your calculated ratios potentially mean for the company’s overall financial condition?
Please assume the market price of the common stock on 12/31/11 was $113.40.
Also, if you need any numbers from 2010 for averages, please use the following:
Cash 300,000
Marketable securities 1,000,000
A/R 345,000
Inventory 647,000
Prepaids 220,000…
You are provided with the Income Statement and the Balance Sheet of HTS software, Inc. for 2011.
Required:
(b) Analyze the current financial position for the company from a time series and cross section viewpoint.
(c) Break your analysis into an evaluation of the firm’s liquidity, activity, debt, profitability and market ratios.
Historical and Industry Average Ratios
HTS Software , Inc.
Ratio
2010
2011
Industry2011
Current Ratio
2.6
2.08
2.7
Quick Ratio
1.8
1.32
1.75
Inventory Turnover
4.5
6
4.7
Average Collection Period
40days
9.125
42 days
Total Asset Turnover
1.2
1.69
1
Debt Ratio
20%
28.2%
21%
Times Interest Earned
9
5.9%
8.9
Gross Profit Margin
43%
42.8%
44%
Operating Profit Margin
30%
25.5%
32%
Net Profit Margin
20%
17%
21%
Return on total assets
12%
4.11%
13%
Return on Equity
Price/Earnings Ratio
15%
7.3
19%
4.4
16%
8…
Chapter 2 Solutions
Financial Accounting
Ch. 2 - Prob. 1YTCh. 2 - Prob. 2YTCh. 2 - Is prepaid insurance an expense or an asset?...Ch. 2 - Prob. 4YTCh. 2 - Give an example of the matching principle from the...Ch. 2 - What is the difference between cash basis and...Ch. 2 - Prob. 7YTCh. 2 - What is GAAP? What is IFRS?Ch. 2 - Prob. 2QCh. 2 - Prob. 3Q
Ch. 2 - Prob. 4QCh. 2 - Prob. 5QCh. 2 - What are the four basic financial statements?Ch. 2 - Which financial statement pertains to a single...Ch. 2 - Prob. 8QCh. 2 - Prob. 9QCh. 2 - Prob. 10QCh. 2 - Prob. 11QCh. 2 - Prob. 12QCh. 2 - What does recognize revenue mean in accounting?Ch. 2 - Prob. 14QCh. 2 - What is an accrual? What is a deferral?Ch. 2 - Must a company collect the money from a sale...Ch. 2 - What is the cost of goods sold?Ch. 2 - Explain the difference between cash basis...Ch. 2 - Prob. 19QCh. 2 - Prob. 20QCh. 2 - Prob. 21QCh. 2 - Prob. 1MCQCh. 2 - Prob. 2MCQCh. 2 - Prob. 3MCQCh. 2 - Prob. 4MCQCh. 2 - Prob. 5MCQCh. 2 - Prob. 6MCQCh. 2 - Prob. 7MCQCh. 2 - Prob. 8MCQCh. 2 - Prob. 9MCQCh. 2 - Prob. 10MCQCh. 2 - Elements of the financial statements. (LO 3). For...Ch. 2 - Prob. 2SEACh. 2 - Prob. 3SEACh. 2 - Prob. 4SEACh. 2 - Prob. 5SEACh. 2 - Prob. 6SEACh. 2 - Cash versus credit sales. (LO 3, 4). Company A had...Ch. 2 - Prob. 8SEACh. 2 - Prob. 9SEACh. 2 - Prob. 10SEACh. 2 - Prob. 11SEBCh. 2 - Prob. 12SEBCh. 2 - Prob. 13SEBCh. 2 - Prob. 14SEBCh. 2 - Prob. 15SEBCh. 2 - Prob. 16SEBCh. 2 - Prob. 17SEBCh. 2 - Prob. 18SEBCh. 2 - Prob. 19SEBCh. 2 - Prob. 20SEBCh. 2 - Prob. 21EACh. 2 - Prob. 22EACh. 2 - Prob. 23EACh. 2 - Balance sheet and income statement transactions....Ch. 2 - Prob. 25EACh. 2 - Prob. 26EACh. 2 - Prob. 27EACh. 2 - Prob. 28EACh. 2 - Elements of the financial statements. (LO 3). The...Ch. 2 - Prob. 30EBCh. 2 - Elements of the financial statements. (LO 3)....Ch. 2 - Prob. 32EBCh. 2 - Prob. 33EBCh. 2 - Prob. 34EBCh. 2 - Prob. 35EBCh. 2 - Current ratio. (LO 5). The following data was...Ch. 2 - Prob. 37PACh. 2 - Prob. 38PACh. 2 - Prob. 39PACh. 2 - Prob. 40PACh. 2 - Prob. 41PACh. 2 - Prob. 42PBCh. 2 - Prob. 43PBCh. 2 - Prob. 44PBCh. 2 - Prob. 45PBCh. 2 - Prob. 46PBCh. 2 - Prob. 1FSACh. 2 - Prob. 2FSACh. 2 - Prob. 3FSA
Knowledge Booster


Learn more about
Need a deep-dive on the concept behind this application? Look no further. Learn more about this topic, accounting and related others by exploring similar questions and additional content below.Similar questions
- a) Using the information provided for 31 Dec 2005, calculate the following: net working capital, current ratio, quick ratio, inventory turnover, average collection period, total debt ratio, gross profit margin, net profit margin, return on total assets, return on equity. b) Evaluate the company’s performance against industry average ratios and compare with last year’s results. To answer, please refer to pictures attachedarrow_forwardCompute the following ratios for the most recent two years, show all values in the computations: 1.Current ratio 2.Accounts receivable turnover 3.Debt ratio(TotalLiabilities/Total Assets, as a percentage) 4.Debt-to-equity ratio Based on the results above, what conclusions can you make about the liquidity and solvency of the company?arrow_forwardPerez Company reported an increase in inventories in thepast year. Discuss the effect of this change on the currentratio (current assets ÷ current liabilities). What does thistell a statement user about Perez Company’s liquidity?arrow_forward
- Describe the trend of operating income from 2007 to 2010. What observations can be drawn? Describe the trend of net income from 2007 to 2010. What observations can be drawn?arrow_forwardThis problem is based on the 2017 annual report of Campbell Soup Company. Answer the following questions. Refer to the Selected Financial Data for parts (a) to (d).Required: Find the net sales in 2014. (Enter your answer in millions.) Calculate the operating income (earnings before interest and taxes) in 2013. (Enter your answer in millions.) Calculate the difference between operating income (earnings before interest and taxes) and net income (net earnings) in 2015. (Enter your answer in millions.) Find the year(s) in which net income (net earnings) decreased compared to the previous year. attatched are the charts needed for the following questions, I have tried to figure these out but I come up with incorrect answers. Thank Youarrow_forwardPerez Company reported higher inventories compared to its competitors in a recent year. Discuss this effect on the current ratio (current assets ÷ current liabilities). What does this tell a statement user about Perez Company’s liquidity?arrow_forward
- Please describe what is meant by “Times Interest Earned.” How is it calculated? Suppose you calculated this ratio for a company for two consecutive years and the results were the following: year 2018 – 24.0 year 2017 – 28.0 Please interpret the results. What conclusions can you draw?arrow_forwardThe most recent balance sheet of Raconteurs, Inc., (in millions) is found here. Calculate Raconteurs’ current ration and acid-test (quick) ratio. Benchmark ratios for the current and acid-test (quick) ratio are 1.49 and 1.22 respectively. What can you say about the liquidity of Raconteur’s operations based on these two ratios?arrow_forwardFollowing are the financial statements of AB Ltd. for 2010. From the aforementioned table, calculate the following: 1. Current ratio 2. Liquid ratio 3. Receivables turnover ratio and collection period 4. Inventory turnover and holding period 5. Fixed assets turnover 6. Total assets turnover 7. Debt ratio 8. D/E ratio 9. Interest coverage ratio 10. PAT margin 11. ROA 12. ROE 13. EPS 14. D/P ratio 15. P/E ratio 16. Book value per sharearrow_forward
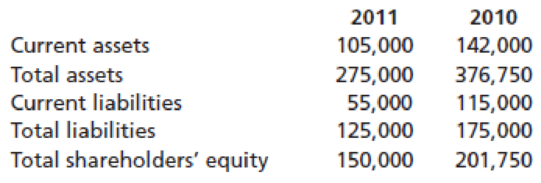
- You are given the financial statements of a company for over the 6-year periods (2016 –2021). Considering 2016 as the base year, compute the trend index for the following items:a. Revenue, cost of goods sold, total expenses and net earnings. Comment on the trends of each of the items.b. Total assets, total liabilities and shareholders’ equity. Comment on the trends of each of the items.c. Cash flow from operation, cash flow from investing, cash flow from financing and closing cash balances. Comment on the trends of each of the items.arrow_forwardYou are provided with the Income Statement and the Balance Sheet of HTS software, Inc. for 2011.Required: (a) Calculate the ratios stated in the table below for HTS Software, Inc. for 2011 (b) Analyze the current financial position for the company from a time series and cross section viewpoint. (c) Break your analysis into an evaluation of the firm’s liquidity, activity, debt, profitability and market ratios.arrow_forwardUse this data to compute the following ratios: 1.Current ratio (Dec 2020 )2.Acid-test Ratio (Dec 2020) 3.Accounts Receivable Turnover 4.Inventory Turnover 5.Return on Assets 6.Profit Margin on Sales 7.Return on Equity 8.Times Interest Earned b.Discuss the financial condition of ABC Company, Inc. based on what you learn from computing the ratios.arrow_forward
arrow_back_ios
SEE MORE QUESTIONS
arrow_forward_ios
Recommended textbooks for you

 AccountingAccountingISBN:9781337272094Author:WARREN, Carl S., Reeve, James M., Duchac, Jonathan E.Publisher:Cengage Learning,
 Accounting Information SystemsAccountingISBN:9781337619202Author:Hall, James A.Publisher:Cengage Learning,
 Horngren's Cost Accounting: A Managerial Emphasis...AccountingISBN:9780134475585Author:Srikant M. Datar, Madhav V. RajanPublisher:PEARSON
 Intermediate AccountingAccountingISBN:9781259722660Author:J. David Spiceland, Mark W. Nelson, Wayne M ThomasPublisher:McGraw-Hill Education
 Financial and Managerial AccountingAccountingISBN:9781259726705Author:John J Wild, Ken W. Shaw, Barbara Chiappetta Fundamental Accounting PrinciplesPublisher:McGraw-Hill Education
Accounting
Accounting
ISBN:9781337272094
Author:WARREN, Carl S., Reeve, James M., Duchac, Jonathan E.
Publisher:Cengage Learning,
Accounting Information Systems
Accounting
ISBN:9781337619202
Author:Hall, James A.
Publisher:Cengage Learning,
Horngren's Cost Accounting: A Managerial Emphasis...
Accounting
ISBN:9780134475585
Author:Srikant M. Datar, Madhav V. Rajan
Publisher:PEARSON
Intermediate Accounting
Accounting
ISBN:9781259722660
Author:J. David Spiceland, Mark W. Nelson, Wayne M Thomas
Publisher:McGraw-Hill Education
Financial and Managerial Accounting
Accounting
ISBN:9781259726705
Author:John J Wild, Ken W. Shaw, Barbara Chiappetta Fundamental Accounting Principles
Publisher:McGraw-Hill Education
IAS 10 Events After the Reporting Period; Author: Silvia of CPDbox;https://www.youtube.com/watch?v=ijYZlb1_ZyQ;License: Standard Youtube License