
(a)
To find: the five-number summary of the dataset.
(a)
Answer to Problem 2.6AYK
| Statistics | Group Instruction | Individual instruction |
| Minimum: | 78 | 128 |
| First quartile: | 117.50 | 159.75 |
| Median: | 147.50 | 191.50 |
| Third quartile: | 172.00 | 221.50 |
| Maximum: | 359 | 283 |
Explanation of Solution
Given:
| Group Instruction | 141 | 158 | 112 | 153 | 134 | 95 | 96 | 78 | 148 |
| 172 | 200 | 271 | 103 | 172 | 359 | 145 | 147 | 255 | |
| Individual instruction | 128 | 195 | 188 | 158 | 227 | 198 | 163 | 164 | |
| 159 | 128 | 283 | 226 | 223 | 221 | 220 | 160 |
Calculation:
The five-point statistics calculated using the Excel is given below:
| Descriptive statistics | ||
|
| Group Instruction | Individual instruction |
| count | 18 | 16 |
| mean | 163.28 | 190.06 |
| sample variance | 4,992.21 | 1,755.66 |
| sample standard deviation | 70.66 | 41.90 |
| minimum | 78 | 128 |
| maximum | 359 | 283 |
| 281 | 155 | |
| 1st quartile | 117.50 | 159.75 |
| median | 147.50 | 191.50 |
| 3rd quartile | 172.00 | 221.50 |
| 54.50 | 61.75 | |
| 172.00 | 128.00 | |
The five-point summery is:
| Statistics | Group Instruction | Individual instruction |
| Minimum: | 78 | 128 |
| First quartile: | 117.50 | 159.75 |
| Median: | 147.50 | 191.50 |
| Third quartile: | 172.00 | 221.50 |
| Maximum: | 359 | 283 |
(b)
To construct: the box plot for the given datasets.
(b)
Explanation of Solution
Calculation:
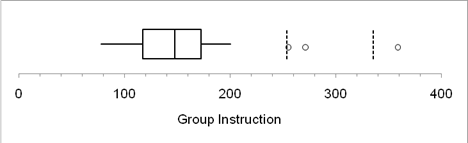
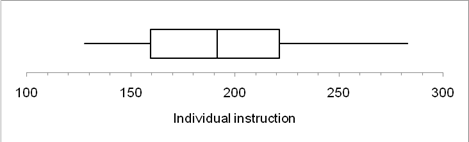
The summery shown by the box plots is given below:
| Statistics | Group Instruction | Individual instruction |
| Minimum: | 78 | 128 |
| First quartile: | 117.50 | 159.75 |
| Median: | 147.50 | 191.50 |
| Third quartile: | 172.00 | 221.50 |
| Maximum: | 359 | 283 |
| low extremes | 0 | 0 |
| low outliers | 0 | 0 |
| high outliers | 2 | 0 |
| high extremes | 1 | 0 |
(c)
To find: the mean and standard deviation and explain whether it defines anything about shape or not.
(c)
Answer to Problem 2.6AYK
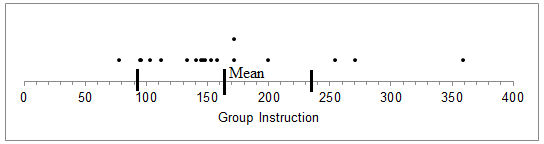
Group Instruction:
Mean = 163.28
Standard Deviation = 70.66
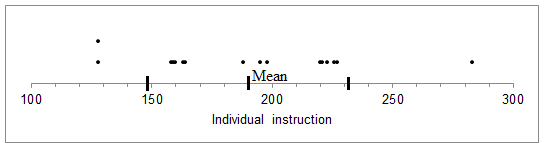
Individual instruction:
Mean =190.66
Standard Deviation = 41.90
Explanation of Solution
Formula used:
Mean = Average(“Array”)
Standard Deviation = stdev.s(“array”)
Calculation:
| Statistics | Group Instruction | Individual instruction |
| Mean | 163.28 | 190.06 |
| Standard Deviation | 70.66 | 41.90 |
No, mean and standard are the values that tells about the central value and the standard deviation tell about the spread of the data but not the shape of the data.
(d)
To represent the mean, one standard deviation above and one standard deviation below the mean on the dot plot of the given two datasets.
(d)
Explanation of Solution
The dot plots showing the mean and one standard deviation below and one standard deviation above than then mean is given below.
Want to see more full solutions like this?
Chapter 2 Solutions
Practice of Statistics in the Life Sciences

 MATLAB: An Introduction with ApplicationsStatisticsISBN:9781119256830Author:Amos GilatPublisher:John Wiley & Sons Inc
 Probability and Statistics for Engineering and th...StatisticsISBN:9781305251809Author:Jay L. DevorePublisher:Cengage Learning
 Statistics for The Behavioral Sciences (MindTap C...StatisticsISBN:9781305504912Author:Frederick J Gravetter, Larry B. WallnauPublisher:Cengage Learning
 Elementary Statistics: Picturing the World (7th E...StatisticsISBN:9780134683416Author:Ron Larson, Betsy FarberPublisher:PEARSON
 The Basic Practice of StatisticsStatisticsISBN:9781319042578Author:David S. Moore, William I. Notz, Michael A. FlignerPublisher:W. H. Freeman
 Introduction to the Practice of StatisticsStatisticsISBN:9781319013387Author:David S. Moore, George P. McCabe, Bruce A. CraigPublisher:W. H. Freeman