
Concept explainers
Videos
Using a random number generator create a sample of four relative densities using the PDF presented in Figure 2.2. Repeat the exercise to create three different sample sets. Compute the mean and standard deviation of your sample. Compute the mean and standard deviation of each sample set. Compare the means and standard deviations of your samples with each other and with the mean and standard deviation of the original distribution. Discuss the differences among the sample sets and the original distribution, including the type of uncertainties you are dealing with. How many samples do you think are needed to reliably determine the mean and standard deviation of the relative density of this particular soil?
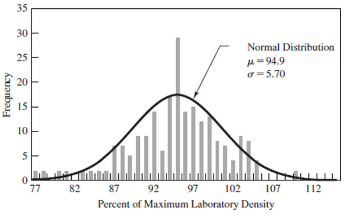
Figure 2.2
Histogram and the corresponding normal distribution of dry unit weight of a compacted soil at a road site in Los Alamos, New Mexico.

Learn your wayIncludes step-by-step video

Chapter 2 Solutions
Foundation Design: Principles and Practices (3rd Edition)
Additional Engineering Textbook Solutions
Elementary Surveying: An Introduction To Geomatics (15th Edition)
Elementary Surveying (14th Edition)
Structural Analysis (10th Edition)
Materials for Civil and Construction Engineers (4th Edition)
Concepts Of Programming Languages
Starting Out with Programming Logic and Design (5th Edition) (What's New in Computer Science)


- draw the particle size distribution curve for the given table using excel.arrow_forwardthe allowed discrepancy for the t-test is 2σ. This means that if your result from the t-test is smaller than 2, there is a 95% probability that the two measurements represent the same quantity and therefore, they are consistent with each other.When a set of data is inconsistent, it indicates that Select one: a. The experiment is incorrect and unreliable. b. There was a calculation mistake. c. The uncertainty on the measurements has been overestimated. d. There are some unknown systematic errors in some or all of the measurements.arrow_forwardA population has a mean of u=30 and a standard deviation of sd=5. a. If 5 points were added to every score in the population, what would be the new values for the mean and standard deviation? b. If every score in the population were multiplied by 3, what would be the new values for the mean and standard deviation?arrow_forward
- Using the F-test for comparing variances of two independent samples, the value of n for v2 is based on the size of the sample with what characteristic?arrow_forwardWhat is the expected error in C in the below equation if you know the random error in A=±28.6 mm and B=±20.4 mm?arrow_forwardA lot of 75 washers contains 6 defectives whose variability in thickness is unacceptably large. A sample of 10 washers is selected at random without replacement. 1. Find the probability that at least one unacceptable washer is in the sample. 2. Calculate the mean of (x). 3. Calculate the variance of (x). 4. Calculate the standard deviation of (x).arrow_forward
- The following data were obtained by a laboratory practice. Calculate γ and γ (sat)arrow_forwardWhat is the expected error in C in the below equation if you know the random error in A=±34 mm and B=±24.4 mm? C=A+Barrow_forwardDetermine the relative precision of the mean of the measured values shown . Trials 1 2 3 4 5 Length (m) 106.87 106.90 106.93 106.89 106.81arrow_forward
- The figure is an example of asymmetrical table and you need to: A. Solve the T max and T min of 10 meters distance from the lowest point to Joint A and B B. Solve the T max and T min of 15 meters distance from the lowest point to Joint A and B if they are all the samearrow_forwardSuppose you have purchased a filling machine for candy bags that is supposed to fill each bag with 16 oz of candy. Assume that the weights of filled bags are approximately normally distributed. A random sample of 10 bags yields the following data (in oz): 15.87 16.02 15.78 15.83 15.69 15.81 16.04 15.81 15.92 16.10 On the basis of these data, can you conclude that the mean fill weight is actually less than 16 oz? State the appropriate null and alternate hypotheses. Compute the value of the test statistic. Find the P-value and state your conclusion.arrow_forwardSelect an appropriate transformation, transform your data and perform a least-squares regression analysis on the transformed data to find a-hat and b-hat.a) Derive the equation that gives the relationship between depth and discharge. b) Compare these results with your Log-Log graph resultsarrow_forward
 Engineering Fundamentals: An Introduction to Engi...Civil EngineeringISBN:9781305084766Author:Saeed MoaveniPublisher:Cengage Learning