![MindTap Engineering for Das/Sobhan's Principles of Geotechnical Engineering, 9th Edition, [Instant Access], 2 terms (12 months)](https://s3.amazonaws.com/compass-isbn-assets/textbook_empty_images/large_textbook_empty.svg)
Videos
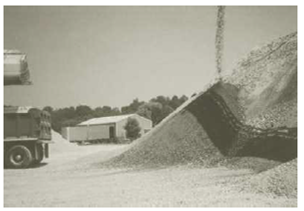
Three groups of students from the
(a)
(b)
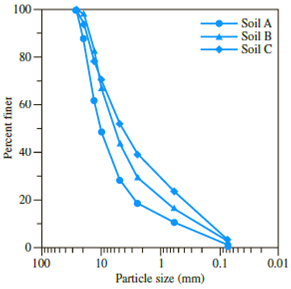
Figure 2.35 (a) Soil-aggregate stockpile; (b) sieve analysis (Courtesy of Khaled Sobhan, Florida Atlantic University, Boca Raton, Florida)
a. Determine the coefficient of uniformity and the coefficient of gradation for Soils A, B, and C.
b. Which one is coarser: Soil A or Soil C? Justify your answer.
c. Although the soils are obtained from the same stockpile, why are the curves so different? (Hint: Comment on particle segregation and representative field sampling.)
d. Determine the percentages of gravel, sand and fines according to Unified Soil Classification System.
(a)
Calculate the coefficient of uniformity
Answer to Problem 2.1CTP
The uniformity coefficient of soil A is
The coefficient of gradation of soil A is
The uniformity coefficient of soil B is
The coefficient of gradation of soil B is
The uniformity coefficient of soil C is
The coefficient of gradation of soil C is
Explanation of Solution
Sketch the grain size distribution curve for soils A, B, and C as shown in Figure 1.
![MindTap Engineering for Das/Sobhan's Principles of Geotechnical Engineering, 9th Edition, [Instant Access], 2 terms (12 months), Chapter 2, Problem 2.1CTP](https://content.bartleby.com/tbms-images/9781305970939/Chapter-2/images/70939-2-2.1ctp_image001.jpg)
Refer to Figure 1.
For soil A:
The diameter of the particle corresponding to
The diameter of the particle corresponding to
The diameter of the particle corresponding to
For soil B:
The diameter of the particle corresponding to
The diameter of the particle corresponding to
The diameter of the particle corresponding to
For soil C:
The diameter of the particle corresponding to
The diameter of the particle corresponding to
The diameter of the particle corresponding to
Calculate the uniformity coefficient
For soil A:
Substitute
Hence, the uniformity coefficient for soil A is
For soil B:
Substitute
Hence, the uniformity coefficient for soil B is
For soil C:
Substitute
Hence, the uniformity coefficient for soil C is
Calculate the coefficient of gradation
For soil A:
Substitute
Hence, the coefficient of gradation for soil A is
For soil B:
Substitute
Hence, the coefficient of gradation for soil B is
For soil C:
Substitute
Therefore, the coefficient of gradation for soil C is
(b)
State which of the soil is coarser from soil A and C.
Answer to Problem 2.1CTP
Soil A is coarser than soil C.
Explanation of Solution
Refer to part (a).
The uniformity coefficient of soil A is
The uniformity coefficient of soil C is
The percent of soil finer than
The percent of soil finer than
Hence, a higher percentage of soil C is finer than soil A.
Hence, soil A is coarser than soil C.
(c)
Explain the reason for curve different of soil A, B and C if it is obtained from same stockpile.
Explanation of Solution
The particle-size distribution curve shows the range of particle sizes present in a soil and the type of distribution of various-size particles.
Refer to Figure 1.
Particle separation of coarser and finer particles may take place in aggregate stockpiles. This makes representative sampling difficult.
Therefore, the particle-size distribution curve is different for soils A, B, and C.
(d)
Calculate the percentages of gravel, sand, and fines according to the Unified Soil Classification System.
Answer to Problem 2.1CTP
The percentage of gravel for soil A is
The percentage of sand for soil A is
The percentage of fines for soil A is
The percentage of gravel for soil B is
The percentage of sand for soil B is
The percentage of fines for soil B is
The percentage of gravel for soil C is
The percentage of sand for soil C is
The percentage of fines for soil C is
Explanation of Solution
Refer to Figure 1.
For soil A.
The percent passing through
The percent passing through
Calculate the percentage of gravel as shown below.
Hence, the percentage of gravel is
Calculate the percentage of sand as shown below.
Hence, the percentage of sand is
Calculate the percentage of fines as shown below.
Hence, the percentage of fines is
Refer to Figure 1.
For soil B.
The percent passing through
The percent passing through
Calculate the percentage of gravel as shown below.
Hence, the percentage of gravel is
Calculate the percentage of sand as shown below.
Hence, the percentage of sand is
Calculate the percentage of fines as shown below.
Hence, the percentage of fines is
Refer to Figure 1.
For soil C.
The percent passing through
The percent passing through
Calculate the percentage of gravel as shown below.
Hence, the percentage of gravel is
Calculate the percentage of sand as shown below.
Hence, the percentage of sand is
Calculate the percentage of fines as shown below.
Hence, the percentage of fines is
Want to see more full solutions like this?
Chapter 2 Solutions
MindTap Engineering for Das/Sobhan's Principles of Geotechnical Engineering, 9th Edition, [Instant Access], 2 terms (12 months)


- Sieve analysis of a sample of fine aggregate resulted in the following data No. Sieve number 4 8 16 30 50 100 Sieve opening (mm) 4.75 2.36 1.18 0.6 0.3 0.15 Weight retained (g) 13 75 120 126 105 61 A) The total weight of the sample, assuming no mass loss during the analysis, is______ (g) a) 505; b) 500; c) 550 B) The half sieve used in the experiment is________. a) No.8; b) No.50; c) none of the above C) The fineness modulus of the aggregate________. a) 6.13; b) 3.16; c) 1.36 D) The average size of the aggregate___________. a) No.30; b) No.4; c) No.16arrow_forwardQ.2) Answer the following question. 1- The sieve analysis below was done for which type of aggregate. Weight of sample = 2000gm Sieve size in. (mm) 3/8" 9.5 mm No.4 4.75 mm No.8 2.36 mm No.16 1.18 mm No.30 0.6 mm No.50 0.3 mm No.100 0.15 mm Pan Percent Weight retained (g) retained 0 2000*100 94 Klcc→ -2000 4032000X100 →0 358420000 360 2000 X 492-20000 72 2000 x 6² 118 982 Percent cumulative @ 4.7 > 95 20 i7-75 18 2212000x100 · 100 29 24.614 57 39 3 Percent passing 0 5 25 уз 61 86 97 317 ASTM Limit 100 95_100 80_100 40 85 25_60 10_30 2_10arrow_forwardQ3. A 1200 g sample of Gravel in the SSD condition in air and weighed 770 g when immersed in water. Also, a 500 g sample of Sand in the SSD condition in air and weighed 300 g when immersed in water Calculate the BSG(SSD) of the sand and gravel 1) the BSG (SSD) of the Gravel * 1.2.791 2.4.71 3.3.703 4.2.50 2) the BSG (SSD) of the Sand * 1.2.221 2.3.590 3.2.500 4.3.232 Choose one answer and write the answer number for mearrow_forward
- In a sieve analysis test, 95.5% of the sample is passing the 5mm sieve and 5.13% is passing sieve #200, which of the following is correct about this sample: There is no clay in the sample the percent of silt and clay is: 5.13% There is 4.5% Sand and Gravel in the sample 95.5% of the sample is Sand and Siltarrow_forwardmpt=541762&cmid%3D103601 Marks 25 Question 1 A sample of AL Batina soil tested in the laboratory. The gradation analysis results are as shown in table Q1. The Atterberg limit tests indicate that the liquid limit is LL = 30% and the plastic limit is PL=27%. Table Q1 Sieve No.# Sieve size (mm) Finer (%) 4 4.75 90 8. 2.36 84 16 1.3 60 30 0.6 30 50 0.2 10 200 0.075 8 i. Determine the uniformity coefficient Marks] ii. Determine curvature coefficient [5 [5 Marks] iii. Classify AL Batina soil according to Unified Soil Classification System (USCS). [10 Marks] iv. Determine the group symbol and group name Marks) [5arrow_forward4. Given: Vicat test data for a cement paste sample, Find: a. The initial set time, b. The final set time. Plot: Penetration vs. Time. Indicate initial and final set points on the graph Time (minutes) 0 15 30 60 75 90 105 120 135 150 165 180 195 210 225 240 255 Penetration (mm) 55 53 50 43 39 34 31 27 23 19 16 11 7 3 0 0 0arrow_forward
- A liquid limit test on a clay was performed with the following results. The natural water content of the clay is 38% and plastic limit is 21%. Number of Blows 6 12 20 28 32 Water content (%) 52.5 47.1 42.3 38.6 37.5 What is the liquid limit of this clay? (Use Interpolation) Group of answer choices 39.85% 39.99% 36.74% 38.63% Please answer this asap for upvote. Thanksarrow_forwardSITUATION 1 A sample of dry coarse- grained materials was taken through a layer of sieves and the following results were obtained. Make the necessary calculations of the following questions. For Situation 1 (Sieve Analysis) SIZE (mm) WEIGHT RETAINED 18.96 gms. 0.25 0.149 33.18 0.074 45.03 0.052 54.51 0.02 42.66 0.01 11.85 0.004 4.74 0.001 4.74 PAN 21.33 Draw the particle distribution curve (manually) Your answerarrow_forwardThe figure and the table below, shows the results of consolidation test for a soil sample, Find the cc value. TI Applied pressure, kPa 25 50 100 200 400 800 Voids ratio 0.634 0.619 0.583 0.523 0456 0383 0.65 0.6 0.55 0.5 0.45 0.4 of 0.35 10 100 1000 PRESSURE 0.15 0.21 0.12 no one 0.30 VOIDS RATIOarrow_forward
- Three samples of aggregates were taken weighed in moist and dry condition. Moist Dry Unit Unit Absorption Volume Aggregate Wt. Wt. (%) (m³) (kN/m) (kN/m³) Sample 1 23.425 20.018 5.14 0.366 Sample 2 22.7 18.757 3.87 0.695 Sample 3 20.292 18.387 2.62 0.237 Where; Unit weight of water = 9.81 kN/m3 Determine the average free moisture content of the three samples.arrow_forwardThree samples of aggregates were taken weighed in moist and dry condition. Moist Dry Unit Absorption Volume (m3) Unit Aggregate Wt. Wt. (%) (kN/m3) (kN/m3) Sample 1 23.425 20.018 5.14 0.366 Sample 2 22.7 18.757 3.87 0.695 Sample 3 20.292 18.387 2.62 0.237 Where; Unit weight of water = 9.81 kN/m3 %3D Determine the average free moisture content of the three samples.arrow_forwardThe following results were obtained from sieve analysis a - Determine the percent finer than each sieve size and plot a grain-size distribution curve b - Determine D10, D30, and D60 from the grain-size distribution curve. c - Calculate the uniformity coefficient, Cu and coefficient of gradation, Ccarrow_forward
 Principles of Geotechnical Engineering (MindTap C...Civil EngineeringISBN:9781305970939Author:Braja M. Das, Khaled SobhanPublisher:Cengage Learning