
The production possibilities curve for 2020 and 2025.
Explanation of Solution
Figure -1 shows the production possibilities curve for 2020 and 2025
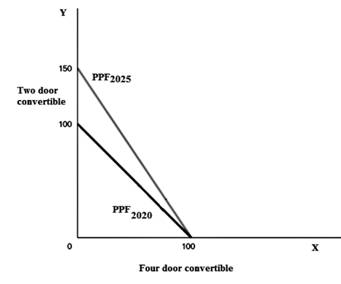
Figure -1
In the above graph, vertical axis measures the two – door convertible and the horizontal axis represents the four – door convertible. In 2020, the maximum production is 100,000 four door sedans or 100,000 two door convertibles. Thus, the apple must be given up producing one –two door convertible to gain one four door sedan.
In 2025, the maximum production is 150,000 two door convertibles or 100,000 four door sedans, thus to gain one four door sedans apple must be give up producing 1.5 two door convertibles.
Opportunity cost of producing one four door sedan in 2020 is 1 two –door convertible
Opportunity cost of producing one four door sedan in 2025 is calculated as follows.
Opportunity cost of producing one four door sedan in 2025 is 1.5 two –door convertible.
Concept introduction:
Opportunity cost: Opportunity cost refers to the value of forgone goods and services to get the other goods and services.
Production possibilities frontier: Production possibilities frontier:
Want to see more full solutions like this?
Chapter 2 Solutions
Economics Plus MyLab Economics with Pearson eText (2-semester Access) -- Access Card Package (6th Edition) (The Pearson Series in Economics)

- Briefly explain how an economy could shift production from an inefficient point of production (such as point E in the picture above) to an efficient point of production (such as point C).arrow_forwardThe figure to the right illustrates the trade-offs facing Ford Motor Company. The line in the graph is Ford's production possibilities frontier. If Ford uses all its resources to produce trucks, how many can it produce? 10.0 thousand trucks per day. (Enter a numeric response using a real number rounded to one decimal place.) Suppose Ford is currently building 3 thousand cars per day. To build an additional 1 thousand cars, how many fewer trucks can be built? thousand fewer trucks per day. According to the graph, building 11 thousand cars and 11 thousand trucks per day is Quantity of trucks (1,000s per day) 12- PPF 7 8 9 10 Quantity of cars (1,000s per day) 12 13 14 Q Qarrow_forwardSuppose the fictional country of Biscayne produces two types of goods: agricultural and capital. The following diagram shows its current production possibilities frontier for sorghum, an agricultural good, and electric scooters, a capital good. Drag the production possibilities frontier (PPF) on the graph to show the effects of a time-saving innovation in the manufacturing of electric scooters. Note: Select either end of the curve on the graph to make the endpoints appear. Then drag one or both endpoints to the desired position. Points will snap into position, so if you try to move a point and it snaps back to its original position, just drag it a little farther. ELECTRIC SCOOTERS (Thousands) 180 150 120 90 30 0 30 60 90 PPF 120 SORGHUM (Millions of bushels) 150 180 бо PPF ?arrow_forward
- Which point(s) are efficient? Briefly explain why. B Points A, B, C, and D because they are attainable. Points B, C, and D because this is where maximum output is produced with available resources. Point A because it is inside the production possibilities frontier. Point E because it is where the most capital and consumption goods combined are produced. A D Point B because it is where the most resources are used to produce capital goods. Which point(s) are inefficient? Briefly explain why. PPF O A. Points B, C, and D because they are on the production possibilities frontier. O B. Points B, C, D, and E because they are unattainable. Consumption goods O C. Points A, B, C, and D because they are attainable. O D. Point E because it is unattainable. OE. Point A because production there is not using all available resources. At which point is the country's future growth rate likely to be the highest? Briefly explain why. O A. Point E because it is where the production possibilities frontier…arrow_forwardBrian and Crystal are farmers. Each one owns an 18-acre plot of land. The following table shows the amount of corn and rye each farmer can produce per year on a given acre. Each farmer chooses whether to devote all acres to producing corn or rye or to produce corn on some of the land and rye on the rest. Corn Rye (Bushels per acre) (Bushels per acre) Brian 15 3 Crystal 20 10 On the following graph, use the blue line (circle symbol) to plot Brian's production possibilities frontier (PPF), and use the purple line (diamond symbol) to plot Crystal's PPF. crystal/brian has an absolute advantage in the production of corn, and crystal/brian has an absolute advantage in the production of rye. Brian's opportunity cost of producing 1 bushel of rye is_____ bushels of corn, whereas Crystal's opportunity cost of producing 1 bushel of rye is_____ bushels of corn. Because brian has a higher/lower opportunity cost of producing rye than Crystal, crystal/brian has a…arrow_forwardSuppose France produces two types of goods: wheat and cars. The following diagram shows its current production possibilities frontier (also known as the production possibilities curve) for wheat and cars. Drag the production possibilities frontier (PPF) on the graph to show the effects of a long drought that reduces the amount of water available for farmers to use for irrigation. Note: Select either end of the curve on the graph to make the endpoints appear. Then drag one or both endpoints to the desired position. Points will snap into position, so if you try to move a point and it snaps back to its original position, just drag it a little farther.arrow_forward
- Suppose Ireland produces two types of goods: agricultural and capital. The following diagram shows its current production possibilities frontier for corn, an agricultural good, and industrial robots, a capital good. Drag the production possibilities frontier (PPF) on the graph to show the effects of a long drought that reduces the amount of water available for farmers to use for irrigation. Note: Select either end of the curve on the graph to make the endpoints appear. Then drag one or both endpoints to the desired position. Points will snap into position, so if you try to move a point and it snaps back to its original position, just drag it a little farther. 120 100 PPF 80 20 PPE 60 120 180 240 300 360 CORN (Millions of bushels) INDUSTRIAL ROBOTS (Thousands)arrow_forwardSuppose the United Kingdom produces two types of goods: agricultural and capital. The following diagram shows its current production possibilities frontier for corn, an agricultural good, and airplanes, a capital good. Drag the production possibilities frontier (PPF) on the graph to show the effects of a technological advance in medicine that allows workers to live longer and have extended careers. Note: Select either end of the curve on the graph to make the endpoints appear. Then drag one or both endpoints to the desired position. Points will snap into position, so if you try to move a point and it snaps back to its original position, just drag it a little farther. 360 300 PPF 240 180 PLANES (Thousands) Carrow_forwardSuppose the fictional country of Everglades produces two types of goods: agricultural and capital. The following diagram shows its current production possibilities frontier for millet, an agricultural good, and telephoto lenses, a capital good. Drag the production possibilities frontier (PPF) on the graph to show the effects of a long drought that reduces the amount of water available for farmers to use for irrigation. Note: Select either end of the curve on the graph to make the endpoints appear. Then drag one or both endpoints to the desired position. Points will snap into position, so if you try to move a point and it snaps back to its original position, just drag it a little farther. TELEPHOTO LENSES (Thousands) 360 300 240 100 120 60 . 10 PPF 20 30 40 MILLET (Millions of bushels) 50 60 PPFarrow_forward
- Elijah and Aneesha are farmers. Each one owns a 14-acre plot of land. The following table shows the amount of maize and squash each farmer can produce per year on a given acre. Each farmer chooses whether to devote all acres to producing maize or squash or to produce maize on some of the land and squash on the rest. Elijah Aneesha SQUASH (Pounds) 140 On the following graph, use the blue line (circle symbol) to plot Elijah's production possibilities frontier (PPF), and use the purple line (diamond symbol) to plot Aneesha's PPF. 126 112 98 84 70 42 28 14 0 Maize (Pounds per acre) 10 18 0 Squash (Pounds per acre) 6 70 140 210 280 350 420 490 560 630 MAIZE (Pounds) 700 Elijah's opportunity cost of producing 1 pound of squash is squash is pounds of maize. Because Elijah has a comparative advantage in the production of squash, and Elijah's PPF Aneesha's PPF (?) Aneesha has an absolute advantage in the production of maize, and Aneesha has an absolute advantage in the production of squash. 2…arrow_forwardGarmin is a technology company that specialises in GPS technology for automotive, aviation, marine, outdoor, and sport activities. Assume they have resources that they want to allocate between the production of GPS smartwatches and fitness trackers.With reference to this:1.1 Explain how Garmin can use a production possibilities frontier to illustrate the various combinations of output of smartwatches and fitness trackers. 1.2 Assume that Garmin has obtained a new technique to produce fitness trackers more efficiently. Critically discuss how the PPF can be used to illustrate that. 1.3 Justify the importance of price elasticity of demand to pricing managers of Garmin. 1.4 With the aid of examples applicable to Garmin, explain the difference between explicit and implicit costs.1.5 Garmin smartwatches may be considered part of an oligopolistic market structure with its main competitors being Fitbit, Huawei, Samsung, and Xiaomi. Propose the type of demand curve that would be faced by Garminarrow_forwardYakov and Ana are farmers. Each one owns a 20-acre plot of land. The following table shows the amount of corn and rye each farmer can produce per year on a given acre. Each farmer chooses whether to devote all acres to producing corn or rye or to produce corn on some of the land and rye on the rest. Yakov Ana RYE (Bushels) On the following graph, use the blue line (circle symbol) to plot Yakov's production possibilities frontier (PPF), and use the purple line (diamond symbol) to plot Ana's PPF. 200 180 160 140 120 100 80 60 40 20 Corn Rye (Bushels per acre) (Bushels per acre) 40 8 28 0 + 0 100 200 7 300 400 500 600 700 800 900 1000 CORN (Bushels) Yakov's opportunity cost of producing 1 bushel of rye is bushels of corn. Yakov's PPF Ana's PPF (?) bushels of corn, whereas Ana's opportunity cost of producing 1 bushel of rye is Because Yakov has a ▼ opportunity cost of producing rye than Ana, has a comparative advantage in the production of corn. has a comparative advantage in the…arrow_forward

 Principles of Economics (12th Edition)EconomicsISBN:9780134078779Author:Karl E. Case, Ray C. Fair, Sharon E. OsterPublisher:PEARSON
 Engineering Economy (17th Edition)EconomicsISBN:9780134870069Author:William G. Sullivan, Elin M. Wicks, C. Patrick KoellingPublisher:PEARSON
 Principles of Economics (MindTap Course List)EconomicsISBN:9781305585126Author:N. Gregory MankiwPublisher:Cengage Learning
 Managerial Economics: A Problem Solving ApproachEconomicsISBN:9781337106665Author:Luke M. Froeb, Brian T. McCann, Michael R. Ward, Mike ShorPublisher:Cengage Learning
 Managerial Economics & Business Strategy (Mcgraw-...EconomicsISBN:9781259290619Author:Michael Baye, Jeff PrincePublisher:McGraw-Hill Education