
Microeconomics: Principles and Policy (MindTap Course List)
13th Edition
ISBN: 9781305280618
Author: William J. Baumol, Alan S. Blinder
Publisher: Cengage Learning
expand_more
expand_more
format_list_bulleted
Question
Chapter 1A, Problem 1TY
To determine
To draw:
A 2-variable diagram and measure the slope of line along with the meaning of the numbers.
Expert Solution & Answer
Explanation of Solution
Slope:
The slope represents the steepness of line or it is the ratio of the change in values on the Y-axis with respect to the X-axis.
The following graph plots the given data:
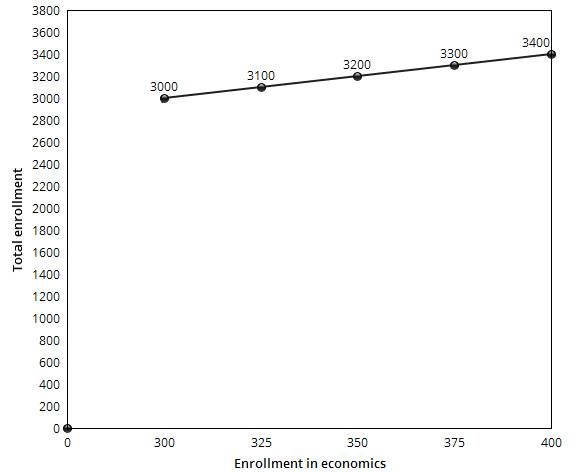
The slope of the line is the same as the horizontal change divided by vertical change.
The slope 4 shows that every 100 enrollment has 25 students of economics each year.
Want to see more full solutions like this?
Subscribe now to access step-by-step solutions to millions of textbook problems written by subject matter experts!
Students have asked these similar questions
Draw the graph of U = q1 + aq2 and U= q1^2 + q2^2. Interpret the parameter and shape of the curve.
1. Solve the following problem by using Excel for graph sketching.
A soda vendor at Louisiana State University football games observes that more sodas
are sold the warmer the temperature at game time is. Based on 32 home games
covering five years, the vendor estimates the relationship between soda sales and
temperature to be y = -240 + 8x, where y = the number of sodas she sells and .x =
temperature in degrees Fahrenheit,
(a) Interpret the estimated slope and intercept. Do the estimates make sense? Why,
or why not?
(b) On a day when the temperature at game time is forecast to be 80°F, predict how
many sodas the vendor will sell.
(c) Below what temperature are the predicted sales zero?
(d) Sketch a graph of the estimated regression line.
Your boss would like your help on a marketing research project she is conducting on the relationship between the price of soda and the quantity of
soda demanded. She hands you the following document:
Price of Soda
Quantity of Soda Demanded
(Dollars per can)
(Billions of cans)
0.50
2,000
0.75
1,500
1.00
1,000
1.25
750
Your task is to take this
and construct a graphical representation of the data. In doing so, you determine that as
the price of soda rises, the quantity of soda demanded decreases. This confirms the
Chapter 1A Solutions
Microeconomics: Principles and Policy (MindTap Course List)
Knowledge Booster

Similar questions
- The table gives information about the relationship between two variables, x and y. The relationship between x and y is ______ and the slope of the relationship ______ as x increases. x 2 4 6 8 10 y 196 192 188 184 180arrow_forwardThe following graph contains four lines (A, B, C and D), each of which has a slope that is either positive, negative, zero, or infinite. Y-axisX-axisBDCA For each of the following scenarios, indicate whether the relationship between the two variables is positive or negative, as well as which line on the previous graph has a slope that reflects this type of relationship. Hint: The X-axis and Y-axis on the graph are not labeled intentionally. You need to substitute the variables from each scenario for the horizontal and vertical axis. For example, in the first scenario, X-axis should be labeled “ ice-cream" and Y-axis should be labeled "The temperature". Scenario Relationship Line As the temperature rises, the demand for ice-cream rises. Negative As the temperature rises, the demand for hot cocoa falls. Positive As the temperature falls, the demand for popsicles falls. Negative True or False: Line B has a slope of infinity.…arrow_forwardConsider the function Y5X03203, where X and Z are both greater than or equal to zero. Complete the following table by calculating the value of Y for each set of values for X and Z. X 16 18 1 8 20 16 14 N 10 6 Use the blue curve (circle symbols) to graph the values from the previous table that correspond to the contour line when Y=20. Use the green curve (triangle symbols) to graph the values from the previous table that correspond to the contour line when ya 30. Finally, use the purple curve (diamond symbols) to graph the values from the previous table that correspond to the contour line when y=40. 5 4 2 z 16 6 D 4 1 1 16 8 18 Y 0 0 10 X 12 14 10 10 20 Contour Line Y 20 N Contour Line Y 30 B Contour Line Y 40arrow_forward
- Calculate the slope and vertical intercept of the line that goes through the points described in the table below. 9 9 X y 0 72 vertical intercept = slope = 1 65 2 58 3 51 4 44 5 37 6 30 7 23 8 16arrow_forwardPlot the following system of equations on the following graph. System of Equations: p=6−2q p=3+qarrow_forwardThe graph shows a relationship between two variables, x and y What is the slope of the relationship at point A? >>> The graph will plot data needed to answer this question The slope of the relationship at point A is >>>If the slope is negative, use a minus sign. If the slope is positive, do not use a plus sign 70- 00- 50- 40- 304 20- 10- y 30 >>> Click on the graph to work out the answer Time Remaining: 01:00:48 €arrow_forward
- On a graph, a positive linear relationship moves down from left to right. This statement is right or wrong? WHY?arrow_forwardConsider the function Y = *square root*pXZ where X > 0 and Z > 0. Draw the contour lines (in the positive quadrant) for this function for Y = 4, Y = 5, and Y = 10. What do we call the shape of these contour lines? Where does the line 20X + 10Z = 200 intersect with the contour lineY = 50?arrow_forwardThe following graph contains four lines (A, B, C and D), each of which has a slope that is either positive, negative, zero, or infinite. For each of the following scenarios, indicate whether the relationship between the two variables is positive or negative, as well as which line on the previous graph has a slope that reflects this type of relationship. Hint: The X-axis and Y-axis on the graph are not labeled intentionally. You need to substitute the variables from each scenario for the horizontal and vertical axis. For example, in the first scenario, X-axis should be labeled “ The average grade received" and Y-axis should be labeled "The number of hours spent studying". Scenario: As the number of hours spent studying rises, the average grade received rises. Relationship: Positive or Negative Line: A, B, C, or D? Scenario: As the number of hours spent watching TV rises, the average grade received falls. Relationship: Positive or Negative Line: A, B, C, or D? Scenario: As the…arrow_forward
- In the accompanying graph, is the slope of curve A A' positive or negative? Does the slope increase or decrease as we move along the curve from A to A'? Answer the same two questions for curve BB'.arrow_forwardYpsilanti Market Research conducted a survey to find out whether people who earn more money purchase more expensive goods. The following graph indicates the relationship between income the survey subjects earned and the price of the car that they purchased. The variable shown on the vertical axis is __________ (options: thousands of dollars per car, thousands of dollars per year, income, thousands of dollars, price, number of goods). The units for the variable on the horizontal axis are _________ (options: thousands of dollars per car, thousands of dollars per year, income, thousands of dollars, price, number of goods). There are two ways to view the information presented on the graph. First, the graph tells us the amount a person with a certain income is likely to spend on a car, and second, it tells us the probable income of a person who spent a certain amount on a car. For example, if an individual earned $50,000 last year and purchased a new car, you would expect that person to…arrow_forwardThe world's population living in extreme poverty has declined linearly between the years 2005 and 2011. In 2005, the percentage of the world's population living in extreme poverty was 20.70% and in 2011, the percentage of the world's population living in extreme poverty was 13.70%. Determine a linear equation that models the world's population in extreme poverty, in percentage, as a function of years since 2005. What is the slope of this function, and what does it tell you in practical terms? Round your answer to the nearest hundredth (0.01). Om = -7.00. The world's population in extreme poverty decreased by 7 percent per year between the years 2005 and 2011. Om = 7.00. The world's population in extreme poverty increased by 7 percent per year between the years 2005 and 2011. Om = 1.17. The world's population in extreme poverty increased by 1.17 percent per year between the years 2005 and 2011. Om = -1.17. The world's population in extreme poverty decreased by 1.17 percent per year…arrow_forward
arrow_back_ios
arrow_forward_ios
Recommended textbooks for you

 Macroeconomics: Principles and Policy (MindTap Co...EconomicsISBN:9781305280601Author:William J. Baumol, Alan S. BlinderPublisher:Cengage Learning
 Microeconomics: Principles & PolicyEconomicsISBN:9781337794992Author:William J. Baumol, Alan S. Blinder, John L. SolowPublisher:Cengage Learning
 Economics (MindTap Course List)EconomicsISBN:9781337617383Author:Roger A. ArnoldPublisher:Cengage Learning

Macroeconomics: Principles and Policy (MindTap Co...
Economics
ISBN:9781305280601
Author:William J. Baumol, Alan S. Blinder
Publisher:Cengage Learning
Microeconomics: Principles & Policy
Economics
ISBN:9781337794992
Author:William J. Baumol, Alan S. Blinder, John L. Solow
Publisher:Cengage Learning
Economics (MindTap Course List)
Economics
ISBN:9781337617383
Author:Roger A. Arnold
Publisher:Cengage Learning