
Videos
Analyzing a Quality Cost Report LO1—8
Mercury, Inc., produces cell phones at its plant in Texas. In recent years, the company’s market share has been eroded by stiff competition from overseas. Price and product quality are the two key areas in which companies compete in this market.
A year ago, the company’s cell phones had been ranked low in product quality in a consumer survey. Shocked by this result, Jorge Gomez, Mercury’s president, initiated an intense effort to improve product quality. Gomez set up a task force to implement a formal quality improvement program. Included on this task force were representatives from the Engineering. Marketing. Customer Service. Production, and Accounting departments. The broad representation was needed because Gomez believed that this was a companywide program and that all employees should share the responsibility for its success.
After the first meeting of the task force, Holly Elsoe, manager of the Marketing Department, asked John Tran, production manager, what he thought of the proposed program. Tran replied. "I have reservations. Quality is too abstract to be attaching costs to it and then to be holding you and me responsible for cost improvements. I like to work with goals that I can see and count! I’m nervous about having my annual bonus based on a decrease in quality costs; there are too many variables that we have no control over.”
Mercury’s quality improvement program has now been in operation for one year. The company’s most recent quality cost report is shown below.
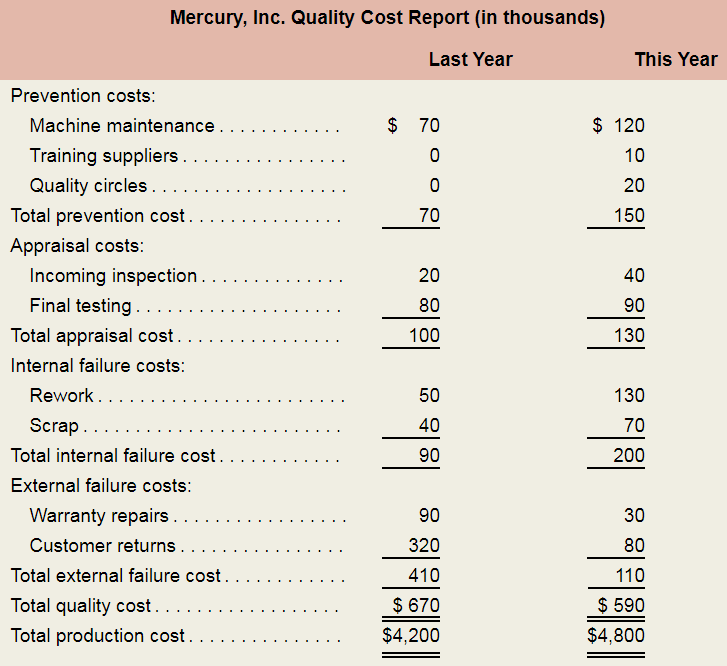
As they were reviewing the report, Elsoe asked Tran what he now thought of the quality improvement program. Tran replied. “I’m relieved that the new quality improvement program hasn’t hurt our bonuses, but the program has increased the workload in the Production Department. It is true that customer returns are way down, but the cell phones that were returned by customers to retail outlets were rarely sent back to us for rework.”
Required:
- Expand the company’s quality cost report by showing the costs in both years as percentages of both total production cost and total quality cost. Carry all computations to one decimal place. By analyzing the report, determine if Mercury, Inc.’s quality improvement program has been successful. List specific evidence to support your answer.
- Do you expect the improvement program as it progresses to continue to increase the workload in the Production Department?
- Jorge Gomez believed that the quality improvement program was essential and that Mercury. Inc., could no longer afford to ignore the importance of product quality. Discuss how Mercury? Inc., could measure the cost of nor implementing the quality improvement program. (CMA, adapted)
Want to see the full answer?
Check out a sample textbook solution
Chapter 1A Solutions
MANAGERIAL ACCOUNTING F/MGRS.


- At the beginning of the last quarter of 20x1, Youngston, Inc., a consumer products firm, hired Maria Carrillo to take over one of its divisions. The division manufactured small home appliances and was struggling to survive in a very competitive market. Maria immediately requested a projected income statement for 20x1. In response, the controller provided the following statement: After some investigation, Maria soon realized that the products being produced had a serious problem with quality. She once again requested a special study by the controllers office to supply a report on the level of quality costs. By the middle of November, Maria received the following report from the controller: Maria was surprised at the level of quality costs. They represented 30 percent of sales, which was certainly excessive. She knew that the division had to produce high-quality products to survive. The number of defective units produced needed to be reduced dramatically. Thus, Maria decided to pursue a quality-driven turnaround strategy. Revenue growth and cost reduction could both be achieved if quality could be improved. By growing revenues and decreasing costs, profitability could be increased. After meeting with the managers of production, marketing, purchasing, and human resources, Maria made the following decisions, effective immediately (end of November 20x1): a. More will be invested in employee training. Workers will be trained to detect quality problems and empowered to make improvements. Workers will be allowed a bonus of 10 percent of any cost savings produced by their suggested improvements. b. Two design engineers will be hired immediately, with expectations of hiring one or two more within a year. These engineers will be in charge of redesigning processes and products with the objective of improving quality. They will also be given the responsibility of working with selected suppliers to help improve the quality of their products and processes. Design engineers were considered a strategic necessity. c. Implement a new process: evaluation and selection of suppliers. This new process has the objective of selecting a group of suppliers that are willing and capable of providing nondefective components. d. Effective immediately, the division will begin inspecting purchased components. According to production, many of the quality problems are caused by defective components purchased from outside suppliers. Incoming inspection is viewed as a transitional activity. Once the division has developed a group of suppliers capable of delivering nondefective components, this activity will be eliminated. e. Within three years, the goal is to produce products with a defect rate less than 0.10 percent. By reducing the defect rate to this level, marketing is confident that market share will increase by at least 50 percent (as a consequence of increased customer satisfaction). Products with better quality will help establish an improved product image and reputation, allowing the division to capture new customers and increase market share. f. Accounting will be given the charge to install a quality information reporting system. Daily reports on operational quality data (e.g., percentage of defective units), weekly updates of trend graphs (posted throughout the division), and quarterly cost reports are the types of information required. g. To help direct the improvements in quality activities, kaizen costing is to be implemented. For example, for the year 20x1, a kaizen standard of 6 percent of the selling price per unit was set for rework costs, a 25 percent reduction from the current actual cost. To ensure that the quality improvements were directed and translated into concrete financial outcomes, Maria also began to implement a Balanced Scorecard for the division. By the end of 20x2, progress was being made. Sales had increased to 26,000,000, and the kaizen improvements were meeting or beating expectations. For example, rework costs had dropped to 1,500,000. At the end of 20x3, two years after the turnaround quality strategy was implemented, Maria received the following quality cost report: Maria also received an income statement for 20x3: Maria was pleased with the outcomes. Revenues had grown, and costs had been reduced by at least as much as she had projected for the two-year period. Growth next year should be even greater as she was beginning to observe a favorable effect from the higher-quality products. Also, further quality cost reductions should materialize as incoming inspections were showing much higher-quality purchased components. Required: 1. Identify the strategic objectives, classified by the Balanced Scorecard perspective. Next, suggest measures for each objective. 2. Using the results from Requirement 1, describe Marias strategy using a series of if-then statements. Next, prepare a strategy map. 3. Explain how you would evaluate the success of the quality-driven turnaround strategy. What additional information would you like to have for this evaluation? 4. Explain why Maria felt that the Balanced Scorecard would increase the likelihood that the turnaround strategy would actually produce good financial outcomes. 5. Advise Maria on how to encourage her employees to align their actions and behavior with the turnaround strategy.arrow_forwardMaxwell Company produces a variety of kitchen appliances, including cooking ranges and dishwashers. Over the past several years, competition has intensified. In order to maintainand perhaps increaseits market share, Maxwells management decided that the overall quality of its products had to be increased. Furthermore, costs needed to be reduced so that the selling prices of its products could be reduced. After some investigation, Maxwell concluded that many of its problems could be traced to the unreliability of the parts that were purchased from outside suppliers. Many of these components failed to work as intended, causing performance problems. Over the years, the company had increased its inspection activity of the final products. If a problem could be detected internally, then it was usually possible to rework the appliance so that the desired performance was achieved. Management also had increased its warranty coverage; warranty work had been increasing over the years. David Haight, president of Maxwell Company, called a meeting with his executive committee. Lee Linsenmeyer, chief engineer; Kit Applegate, controller; and Jeannie Mitchell, purchasing manager, were all in attendance. How to improve the companys competitive position was the meetings topic. The conversation of the meeting was recorded as seen on the following page: DAVID: We need to find a way to improve the quality of our products and at the same time reduce costs. Lee, you said that you have done some research in this area. Would you share your findings? LEE: As you know, a major source of our quality problems relates to the poor quality of the parts we acquire from the outside. We have a lot of different parts, and this adds to the complexity of the problem. What I thought would be helpful would be to redesign our products so that they can use as many interchangeable parts as possible. This will cut down the number of different parts, make it easier to inspect, and cheaper to repair when it comes to warranty work. My engineering staff has already come up with some new designs that will do this for us. JEANNIE: I like this idea. It will simplify the purchasing activity significantly. With fewer parts, I can envision some significant savings for my area. Lee has shown me the designs so I know exactly what parts would be needed. I also have a suggestion. We need to embark on a supplier evaluation program. We have too many suppliers. By reducing the number of different parts, we will need fewer suppliers. And we really dont need to use all the suppliers that produce the parts demanded by the new designs. We should pick suppliers that will work with us and provide the quality of parts that we need. I have done some preliminary research and have identified five suppliers that seem willing to work with us and assure us of the quality we need. Lee may need to send some of his engineers into their plants to make sure that they can do what they are claiming. DAVID: This sounds promising. Kit, can you look over the proposals and their estimates and give us some idea if this approach will save us any money? And if so, how much can we expect to save? KIT: Actually, I am ahead of the game here. Lee and Jeannie have both been in contact with me and have provided me with some estimates on how these actions would affect different activities. I have prepared a handout that includes an activity table revealing what I think are the key activities affected. I have also assembled some tentative information about activity costs. The table gives the current demand and the expected demand after the changes are implemented. With this information, we should be able to assess the expected cost savings. Additionally, the following activity cost data are provided: Purchasing parts: Variable activity cost: 30 per part number; 20 salaried clerks, each earning a 45,000 annual salary. Each clerk is capable of processing orders associated with 100 part numbers. Inspecting parts: Twenty-five inspectors, each earning a salary of 40,000 per year. Each inspector is capable of 2,000 hours of inspection. Reworking products: Variable activity cost: 25 per unit reworked (labor and parts). Warranty: Twenty repair agents, each paid a salary of 35,000 per year. Each repair agent is capable of repairing 500 units per year. Variable activity costs: 15 per product repaired. Required: 1. Compute the total savings possible as reflected by Kits handout. Assume that resource spending is reduced where possible. 2. Explain how redesign and supplier evaluation are linked to the savings computed in Requirement 1. Discuss the importance of recognizing and exploiting internal and external linkages. 3. Identify the organizational and operational activities involved in the strategy being considered by Maxwell Company. What is the relationship between organizational and operational activities?arrow_forwardIn 20X1, Don Blackburn, president of Price Electronics, received a report indicating that quality costs were 31% of sales. Faced with increasing pressures from imported goods. Don resolved to take measures to improve the overall quality of the companys products. After hiring a consultant in 20X1, the company began an aggressive program of total quality control. At the end of 20X5, Don requested an analysis of the progress the company had made in reducing and controlling quality costs. The accounting department assembled the following data: Required: 1. Compute the quality costs as a percentage of sales by category and in total for each year. 2. Prepare a multiple-year trend graph for quality costs, both by total costs and by category. Using the graph, assess the progress made in reducing and controlling quality costs. Does the graph provide evidence that quality has improved? Explain. 3. Using the 20X1 quality cost relationships (assume all costs are variable), calculate the quality costs that would have prevailed in 20X4. By how much did profits increase in 20X4 because of the quality improvement program? Repeat for 20X5.arrow_forward
- Bannister Company, an electronics firm, buys circuit boards and manually inserts various electronic devices into the printed circuit board. Bannister sells its products to original equipment manufacturers. Profits for the last two years have been less than expected. Mandy Confer, owner of Bannister, was convinced that her firm needed to adopt a revenue growth and cost reduction strategy to increase overall profits. After a careful review of her firms condition, Mandy realized that the main obstacle for increasing revenues and reducing costs was the high defect rate of her products (a 6 percent reject rate). She was certain that revenues would grow if the defect rate was reduced dramatically. Costs would also decline as there would be fewer rejects and less rework. By decreasing the defect rate, customer satisfaction would increase, causing, in turn, an increase in market share. Mandy also felt that the following actions were needed to help ensure the success of the revenue growth and cost reduction strategy: a. Improve the soldering capabilities by sending employees to an outside course. b. Redesign the insertion process to eliminate some of the common mistakes. c. Improve the procurement process by selecting suppliers that provide higher-quality circuit boards. Required: 1. State the revenue growth and cost reduction strategy using a series of cause-and-effect relationships expressed as if-then statements. 2. Illustrate the strategy using a strategy map. 3. Explain how the revenue growth strategy can be tested. In your explanation, discuss the role of lead and lag measures, targets, and double-loop feedback.arrow_forwardThe Chromosome Manufacturing Company produces two products, X and Y. The company president, Gene Mutation, is concerned about the fierce competition in the market for product X. He notes that competitors are selling X for a price well below Chromosome's price of P12.70. At the same time, he notes that competitors are pricing product Y almost twice as high as Chromosome's price of P12.50. Mr. Mutation has obtained the following data for a recent time period: PRODUCT X PRODUCT Y Number of Units 11,000 3,000 Direct Materials Cost Per Unit 3.23 3.09 Direct Labor Cost Per Unit 2.22 2.10 Direct Labor Hours 10,000 2,500 Machine Hours 2,100 2,800 Inspection Hours 80 100 Purchase Orders 10 10 Mr. Mutation has learned that overhead costs are assigned to products on the basis of direct labor hours. The overhead costs for his time period consisted of the following items: Overhead Cost Item Amount Inspecting Costs…arrow_forwardMaxwell Company produces a variety of kitchen appliances, including cooking ranges and dishwashers. Over the past several years, competition has intensified. In order to maintain—and perhaps increase—its market share, Maxwell’s management decided that the overall quality of its products had to be increased. Furthermore, costs needed to be reduced so that the selling prices of its products could be reduced. After some investigation, Maxwell concluded that many of its problems could be traced to the unreliability of the parts that were purchased from outside suppliers. Many of these components failed to work as intended, causing performance problems. Over the years, the company had increased its inspection activity of the final products. If a problem could be detected internally, then it was usually possible to rework the appliance so that the desired performance was achieved. Management also had increased its warranty coverage; warranty work had been increasing over the years. DAVID…arrow_forward
- Benchmark Industries manufactures large workbenches for industrial use. Wally Garcia, the vice president for marketing at Benchmark, has concluded from his market analysis that sales are dwindling for Benchmark's standard table because of aggressive pricing by competitors. Benchmark's table sells for P875 whereas the competition's comparable table is selling in the P800 range. Garcia has determined that dropping price to P800 is necessary to regain the firm's annual market share of 10,000 tables. Cost data based on sales of 10,000 tables are: Budgeted Amount 400,000 sq. ft. 85,000 hrs. 30,000 hrš: 320,000 hrs. Actual Amount Actual Cost 425,000 sq. ft. 100,000 hrs. 30,000 hrs. - 320,000 hrs. Direct materials Direct labor Machine setups Mechanical assembly P2,700,000 1,000,000 300,000 4,000,000arrow_forwardTool Industries manufactures large workbenches for industrial use. Sam Hartnet, the Vice President for marketing at Tool Industries, concluded from market analysis that sales were dwindling for Tool's workbenches due to aggressive pricing by competitors. Tool's workbench sells for $1,140 whereas the competition's comparable workbench sells for $1,060. Sam determined that a price drop to $1,060 would be necessary to protect its market share and maintain an annual sales level of 13,000 workbenches.Cost data based on sales of 13,000 workbenches: Budgeted Quantity Actual Quantity Actual Cost Direct materials (pounds) 175,000 168,000 $ 3,450,000 Direct labor (hours) 72,800 71,500 825,000 Machine setups (number of setups) 900 880 250,000 Mechanical assembly (machine hours) 273,000 281,250 3,750,000 If the profit per unit is maintained, the target cost per unit is (rounded to the nearest whole dollar): Multiple Choice $489. $557. $516. $424.…arrow_forwardRequired information [The following information applies to the questions displayed below] For many years, Leno Corporation has used a straightforward cost-plus pricing system, marking its goods up approximately 25 percent of total cost. The company has been profitable; however, it has recently lost considerable business to foreign competitors that have become very aggressive in the marketplace. These firms appear to be using target costing. An example of Leno's problem is typified by item no. 8976, which has the following unit-cost characteristics: Direct material Direct labor $110 240 Manufacturing overhead 160 Selling and administrative expenses 90 The going market price for an identical product of comparable quality is $650, which is significantly below what Leno is charging. Required: 1. Which of the two approaches could be aptly labeled price-led costing?arrow_forward
- Quality Chairs Incorporated (QC) manufactures chairs for industrial use. Laura Winters, the Vice President for Marketing at QC, concluded from market analysis that sales were dwindling for QC's standard three-foot chair due to aggressive pricing by competitors. QC's chairs sold for $550 whereas the competition's comparable chair was selling for $495. Winters determined that a price drop to $495 would be necessary to regain market share and reach a targeted annual sales level of 10,000 chairs.Cost data based on sales of 10,000 chairs: Budgeted Quantity Actual Quantity Actual Cost Direct materials (board feet) 88,000 79,500 $ 1,250,000 Direct labor (hours) 71,350 73,775 875,000 Machine hours (hours) 11,400 11,250 250,000 Finishing and packing (hours) 6,500 6,400 125,000 The current cost per unit is: Multiple Choice $250. $300. $400. $450. $475.arrow_forwardIn response to intensive foreign competition, the management of Florex Company has attempted over the past year to improve the quality of its products. A statistical process control system has been installed and other steps have been taken to decrease the amount of warranty and other field costs, which have been trending upward over the past several years. Costs relating to quality and quality control over the last two years are given below: Costs (in thousands) Last This Year Year $ 1,584 Inspection Quality engineering Depreciation of test eguipment 765 540 675 630 225 $ 1,260 $ 1,620 225 Rework labor Statistical process control Cost of field servicing $ 1,710 1,170 81 Supplies used in testing Systems development Warranty repairs Net cost of scrap Product testing Product recalls 45 630 900 1,260 24 4,140 1,530 $ 1,440 990 540 900 $ 2,700 900 Disposal of defective products 900 Sales have been flat over the past few years, at $90,000,000 per year. A great deal of money has been spent in…arrow_forwardAsbury Coffee Enterprises (ACE) manufactures two models of coffee grinders: Personal and Commercial. The Personal grinders have a smaller capacity and are less durable than the Commercial grinders. ACE only recently began producing the Commercial model. Since the Introduction of the new product, profits have been steadily declining, although sales have been increasing. The management at ACE belleves that the problem might be in how the accounting system allocates costs to products. The current system at ACE allocates manufacturing overhead to products based on direct labor costs. For the most recent year, which Is representative, manufacturing overhead totaled $2,091,000 based on production of 30,000 Personal grinders and 10,000 Commercial grinders. Direct costs were as follows: Direct materials Direct labor Personal $ 1,448,200 1,034,000 Commercial $ 661,000 708,500 Total $ 2,109,200 1,742,500 Management has determined that overhead costs are caused by three cost drivers. These…arrow_forward
 Managerial Accounting: The Cornerstone of Busines...AccountingISBN:9781337115773Author:Maryanne M. Mowen, Don R. Hansen, Dan L. HeitgerPublisher:Cengage Learning
 Cornerstones of Cost Management (Cornerstones Ser...AccountingISBN:9781305970663Author:Don R. Hansen, Maryanne M. MowenPublisher:Cengage Learning
 Accounting Information SystemsAccountingISBN:9781337619202Author:Hall, James A.Publisher:Cengage Learning,