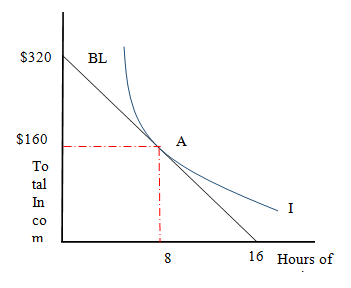
- Leandro’s time allocation budget line and indifference curve at optimal choice.
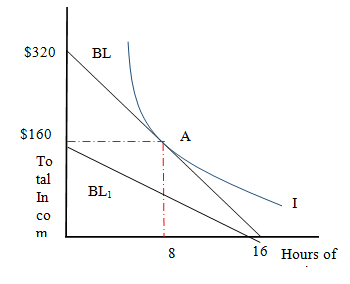
- Leandro’s new budget line due to change in wage rate.
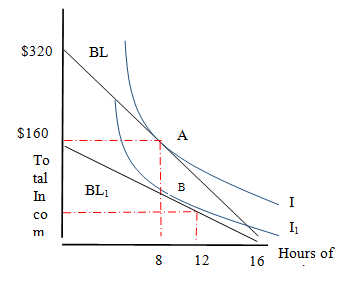
- Leandro’s indifference curve at optimal choice due to change in wage rate.
- Income and substitution effect.
Concept Introduction:
Indifference curve − An indifference curve is a graph showing combination of two goods that give the consumer equal satisfaction and utility. It represents how much value an individual receives from various combinations of consumption. An individual does not have just one indifference curve. They will have an identically shaped curve at different level of incomes.
Budget line on the other hand is graphical representation of all possible combination of two goods which can be purchased with a given income and prices.
Explanation of Solution
If Leandro spends all of his time working his total income will be 16 x $20 = $320. But if Leandro spends all of his time in leisure he will not have any income. This would give us a time allocation budget line labelled as BL. Now since Leandro decides to consume 8 hours of leisure, he will work for remaining 8 hours a day and have an income of $160. That is Leandro gives up $20 for every hour in which he consumes leisure. The indifference curve in this situation will be tangent to the allocation budget line BL at point A, as given in the diagram below.
As Leandro’s wage rate falls to $10, he might work for 16 hours a day as spending 8 hours on leisure will reduce his total income from $160 (16 x $10) to $80. Considering the substitution effect, Leandro will consume less leisure as the
opportunity cost of leisure will be expensive and substitution effect states that goods which are less expensive will be selected by an individual. In such a situation, the budget line will be represented by a new budget line BL1.If Leandro spends only 4 hours at work due to his reduced wage rate, his total income will be $40. That is, he spends 12 hours a day as leisure time and works for only 4 hours. The indifference curve in such a situation will be tangent to budget line BL1,at point B, as he is working for half the time at the reduced wage rate (i.e at $10 he was working for 8 hours initially and has now reduced his work hours by half the time, 4 hours).
In the above diagram we see that, when Leandro was working for 16 hours a day his total income at the wage rate of $20 was $320. However, he decided to substitute 8 hours of work with leisure and was earning an income of $160. This was due to the income effect. Income effect states that an increase in the wage rate of an individual will lead to an increase in the quantity of goods demanded. That means an increase in Leandro’s income will induce him to spend more time on leisure. When Leandro’s wage rate reduced to $10 per hour, his total income was $40 because of reduced hours of work. This was due to reduced opportunity cost. Leandro had to sacrifice only $10 per hour as compared to $20 for leisure. However, reducing the work hours along with reduced wage rate resulted in Leandro becoming poorer, so he should consume less leisure as it is a normal good. Since the overall consumption has increased from 8 hours to 12 hours, the substitution effect dominates effect.


Want to see more full solutions like this?
Chapter 19A Solutions
Microeconomics

 Principles of Economics (12th Edition)EconomicsISBN:9780134078779Author:Karl E. Case, Ray C. Fair, Sharon E. OsterPublisher:PEARSON
 Engineering Economy (17th Edition)EconomicsISBN:9780134870069Author:William G. Sullivan, Elin M. Wicks, C. Patrick KoellingPublisher:PEARSON
 Principles of Economics (MindTap Course List)EconomicsISBN:9781305585126Author:N. Gregory MankiwPublisher:Cengage Learning
 Managerial Economics: A Problem Solving ApproachEconomicsISBN:9781337106665Author:Luke M. Froeb, Brian T. McCann, Michael R. Ward, Mike ShorPublisher:Cengage Learning
 Managerial Economics & Business Strategy (Mcgraw-...EconomicsISBN:9781259290619Author:Michael Baye, Jeff PrincePublisher:McGraw-Hill Education


