
Concept explainers
Videos
Construct amplitude and phase line spectra for Prob. 19.4.
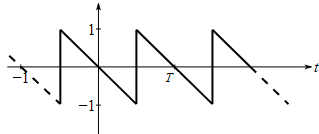
To graph: The amplitude and phase line spectra for the sawtooth wave as shown in the following figure,
Explanation of Solution
Given Information: The sawtooth wave given in the following figure,
Formula used:
Consider
then the Fourier series expansion of the function,
And the coefficients are defined by,
Alternatively, the Fourier series can also be written as,
Here, the amplitude
Plot
Graph:
Consider the sawtooth wave given in the following figure,
Therefore, the sawtooth wave is a periodic function
Therefore, the sawtooth wave,
Therefore, the Fourier series expansion of this function is,
In the above expression, the coefficients are defined by,
Now, find
Consider,
Hence,
Further,
Therefore,
Now, find
Consider,
Hence,
Further,
Thus,
Hence, the coefficients of the Fourier series expansions are,
That is,
Consider,
Thus, the amplitude of the
Furthermore, consider,
As
As
Therefore,
Thus, the phases corresponding to
Use the following MATLAB code to construct the amplitude plot.
Execute the above code to obtain the amplitude plot as,
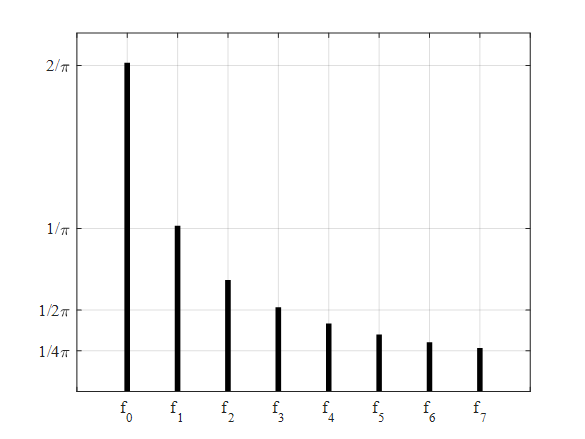
Interpretation: The above plot shows the amplitude plot for the sawtooth wave as shown in the figure provided.
Use the following MATLAB file can be used to construct the phase plot.
Execute the above code to obtain the plot as,
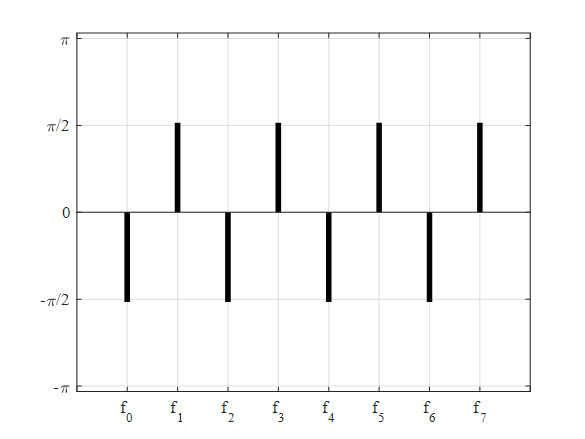
Interpretation: The above plot shows the phase line spectra for the sawtooth wave as shown in the figure provided.
Want to see more full solutions like this?
Chapter 19 Solutions
Numerical Methods For Engineers, 7 Ed


- How is constant amplitude sustained in forced oscillations?arrow_forwardAn undamped spring mass system has a mass of 10 kg and a spring stiffness of 2250 N/m. It is excited by a harmonic force having a sine function characteristic with amplitude of 100 N and an excitation frequency of 15 rad/s. The initial displacement and the velocity are 0.15 m and 1.5 m/s respectively. The Particular solution at t = 2s The frequency ratio is: Choose... Choose...arrow_forwarde 3 ll 42% 16:32 ... INOI 920JUJUUWStuueimis.Jlu.euu.iD: Ovitch account 15 MCQS In an oscillatory motion of a simple pendulum, the ratio of the maximum angular acceleration, e"max, to the maximum angular velocity, O'max, is TT S^(-1). What is the time needed for the pendulum to complete two oscillations? 4 sec 1 sec 2 sec 0.25 sec 0.5 sec A simple pendulum is made of a 50arrow_forward
- 1 Problem 5 4 State, x(t) SAWNO-Nw. ● ● Case 1 O 2 6 Time, sec. underdamped critically damped State, x(t) • overdamped 54321 ONS TY Case 2 2 ▷ Time, sec. 8 10 State, x(t) 5 2 + 3 4 Case 3 2 ▷ 6 Time, sec. 5432 State, x(t) & A & No. 2 Match each of the resposes above to one of the following second-order system types: • undamped Case 4 ▷ Time, sec.arrow_forward6. A 1kg mass is attached to a spring (with spring constant k = 4 N/m), and the spring itself is attached to the ceiling. If you pull the mass down to stretch the spring past its equilibrium position, when you release the mass and observe its (vertical) position, it's said to undergo simple harmonic motion. AT REST MASS PULLED DOWN wwww Under certain initial conditions, the mass's vertical position (in metres) relative to its equilibrium position at time t, y(t), can be modelled by the equation y(t) = cos(2t) – sin(2t), (Note that y measures how much the spring has been stretched, so y = 1 indicates the mass is Im below its equilibrium position, whereas y = -1 indicates it is 1m above its equilibrium position.) (a) Find expressions for the mass's (vertical) velocity v(t) (relative to its equilibrium position) and the mass's (vertical) acceleration a(t) (relative to its equilibrium position). (b) Is the mass moving toward the ceiling or toward the floor at t= T? Justify your answer with…arrow_forwardB/s "ll 35.ll 2_53371919584... Discussion: -Large numerical values of k imply that a spring is very "stiff" and conversely. small values of k signify a "soft spring." Why? -Is the period of the mass-spring system dependent upon the amplitude of oscillation ?arrow_forward
- Determine the steady-state amplitudes of each of the blocks of Fig. P7.l.arrow_forwardQ2 The angular position c of a mass is controlled by a servo system through a referen signal °r. The moment of inertia of moving parts referred to the load shaft, J, is 150 kebo and damping torque coefficient referred to the load shafi(B, is 4.5 x 10³ Nw-m fraden The torque developed by the motor at the load s 7.2 x 10* Nw-m per radian of error (a)Obtain the response of the system to a step input of 1 rad and determine the peak time, peak overshoot and frequency of transient oscillations. Also find the steady state error for à constant angular velocity of 1 revolution / minute. (b)If a steady torque of 1000 Nwm is applied at the load shaft, determine the steady Kan state error. 5(J5+ B) 03 For the system shown, apply a proportional controller to move the time constant to a sixth of its open loop value. R(s) + E(s) U(s) Kp 'Y(s) s +0.333 10arrow_forwardQuestion 4 A uniform rod of length L and mass M and is pivoted without friction about an axis through its midpoint (/ ML). A horizontal spring with constant k is 12 %3D attached to the lower end of the rod, with other end of the spring attached to a rigid support. The rod is displaced by a small angle 0 from the vertical and released. Find the period of the oscillation.arrow_forward
- 1- Please, Derive Equation of Motion for the 2DOF system with Base Excitation as Harmonic motion.arrow_forward2.10 Derive the equation for the displacement response of a viscously damped SDF system due to ini- tial velocity u(0) for three cases: (a) underdamped systems; (b) critically damped systems; and (c) overdamped systems. Plot u(t) : u(0)/w, against t/T, for 5 =0.1, 1, and 2.arrow_forwardQ5:- Fill the following blanks with suitable words. (a) The accelerometer must have... natural frequency. (b) The dissipation of energy in structural damping is hysteresis loop in the form of ........... (c) Simple harmoni motion can be represented by an exponential function with... ..........exponent. (d) The seismograph must have .. natural frequency. Q6:- Write TRUE on the correct sentences and FALSE on the wrong sentences listed below:- (a) The natural frequency of a body is independent on the material of the body. (b) The nature of decay in the friction damping is linear. (c) The energy method can be applied for forced vibration cases. (d) The condition of synchronous whirling is that the whirling and the rotating speeds of the shaft are equal.arrow_forward
 Elements Of ElectromagneticsMechanical EngineeringISBN:9780190698614Author:Sadiku, Matthew N. O.Publisher:Oxford University Press
 Mechanics of Materials (10th Edition)Mechanical EngineeringISBN:9780134319650Author:Russell C. HibbelerPublisher:PEARSON
 Thermodynamics: An Engineering ApproachMechanical EngineeringISBN:9781259822674Author:Yunus A. Cengel Dr., Michael A. BolesPublisher:McGraw-Hill Education
 Control Systems EngineeringMechanical EngineeringISBN:9781118170519Author:Norman S. NisePublisher:WILEY
 Mechanics of Materials (MindTap Course List)Mechanical EngineeringISBN:9781337093347Author:Barry J. Goodno, James M. GerePublisher:Cengage Learning
 Engineering Mechanics: StaticsMechanical EngineeringISBN:9781118807330Author:James L. Meriam, L. G. Kraige, J. N. BoltonPublisher:WILEY