
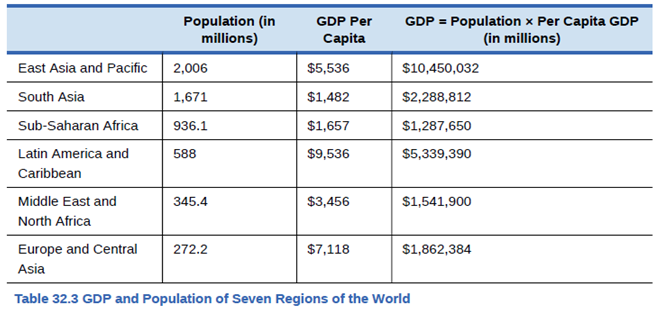
Using the data in Table 32.3, rank the seven regions of the world according to GDP and then according to GDP per capita.
The rank:
The given regions of the world according to the GDP and then according to the GDP per capita
Explanation of Solution
As per the table given, the rankings are as follows:
| Countries | Population
|
GDP per capita
|
Ranking as GDP | |
| East Asia and Pacific | I | |||
| Latin America and Caribbean | II | |||
| South Asia | III | |||
| Europe and Central Asia | IV | |||
| Middle East and North Africa | V | |||
| Sub-Saharan Asia | VI |
| Countries | Population
|
GDP per capita
|
Ranking as GDP per capita | |
| Latin America and Caribbean | I | |||
| Europe and Central Asia | II | |||
| East Asia and Pacific | III | |||
| Middle East and North Africa | IV | |||
| Sub-Saharan Asia | V | |||
| South Asia | VI |
Economist measures a nation’s standard of living through its GDP per capita. GDP measures annual economic output that is total value of goods and services produced within a country.
The low-income countries are those which are having GDP per capita income less than
Want to see more full solutions like this?
Chapter 19 Solutions
Principles of Macroeconomics 2e
Additional Business Textbook Solutions
Horngren's Accounting (11th Edition)
Financial Accounting (12th Edition) (What's New in Accounting)
Managerial Accounting (4th Edition)
Managerial Accounting (5th Edition)
Construction Accounting And Financial Management (4th Edition)
Horngren's Accounting (12th Edition)

- Retrieve the following data from The World Bank database (http //databank.worldbank. org/data/ home.aspx) for India, Spain, and South Africa for the most recent year available: • GDP in constant international dollars or PPP • Population • GOP per person in constant international dollars • Mortality rate, infant (per 1,000 live births) • Health expenditure per capita (current U.S. dollars) • Life expectancy at birth, total (years)arrow_forwardUsing the research skills you have acquired, retrieve the following data from The World Bank database (http://databank.worldbank.orgdata home.aspx) for India, Spain, and South Africa for 20102015, if available: • Telephone lines • Mobile cellular subscriptions • Secure Internet servers (per one million people) • Electricity production (kWh) Prepare a chart that compares these three countries. Describe the key differences between the countries.arrow_forwardWe measure standards of living using GDP per capita. Using the production function, which of the following factors does NOT help to explain differences in GDP per capita between countries: a) human capital per worker b) productivity c) inflation rates d) physical capital per workerarrow_forward
- The following table shows the GDP per capita since 1820 in selectedcountries (in PPP-adjusted 2005 dollars). 1. Identify the countries that experienced catch-up growth from 1920 to2010.arrow_forwardCountries with low GDP per person tend to have a. lower rates of child malnutrition. b. fewer infants with low birth weight. c. higher rates of infant mortality. d. more access to safe drinking water.arrow_forwardIn 1980, Denmark had a GDP of $70 billion (measured in U.S. dollars) and a population of 5.1 million. In 2000, Denmark had a GDP of $160 billion (measured in U.S. dollars) and a population of 5.3 million. By what percentage did Denmark’s GDP per capita rise between 1980 and 2000?arrow_forward
- Using Market Exchange Rates rather than PPP Exchange rates... a. underestimates GDP for developing countries, because in developing countries non-tradable goods tend to be a large fraction of GDP b.is not important, because GDP of developing countries is low anyway c.overestimates GDP for developing countries, because in developing countries non-tradable goods tend to be a large fraction of GDP d.underestimates GDP for developed countries like the US, and overestimates GDP for developing countries like Indiaarrow_forwardThe following table shows the GDP per capita since 1820 in selectedcountries (in PPP-adjusted 2005 dollars). 1. Identify the countries that experienced sustained growth between 1820and 2010.arrow_forwardCountry A and Country B start with the same GDP per capita of $50,000. Country A's GDP per capita grows at a constant rate of 2.8% and Country B's GDP per capita grows at a constant rate of 1.4%. Use the rule of 70 to compute the difference in GDP per capita for these two countries after 100 years, in thousands of dollars.arrow_forward
- should the GDP per capita in the united states be higher than Canada'sarrow_forwardWith three economies, each of which has a GDP per capita of $100. Trend growth in these economies is 2%, 2.5%, and 5% respectively. Calculate GDP per capita for each economy after 5,10,20,50, and 100 years.arrow_forwardWhich of the following refers to those who are interested in assessing the relative standard of living in different countries over a given period? a.Percentage change in nominal GDP b.Population c.Per capita GDP. d.Nominal GDParrow_forward
 Principles of Economics 2eEconomicsISBN:9781947172364Author:Steven A. Greenlaw; David ShapiroPublisher:OpenStax


