1.
Cost-Volume-Profit Analysis: It is a method followed to analyze the relationship between the sales, costs, and the related profit or loss at various levels of units sold. In other words, it shows the effect of the changes in the cost and the sales volume on the operating income of the company.
To construct: a cost-volume-profit chart indicating the break-even sales for last year.
1.
Explanation of Solution
Construct a cost-volume-profit chart indicating the break-even sales for last year.
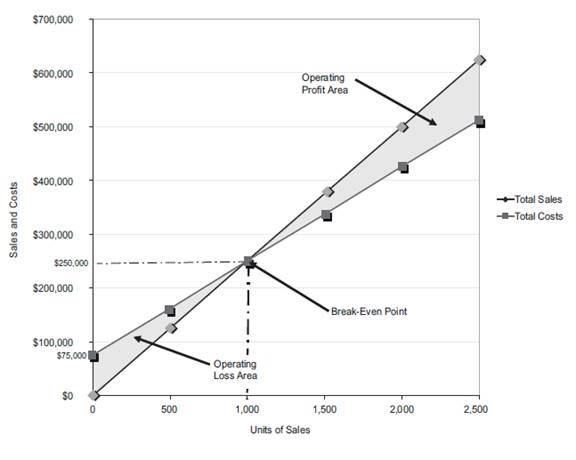
Figure (1)
The volume in units of sales is shown on the horizontal axis. The maximum relevant range is 2,500 units. The sales and the total costs (fixed cost and variable cost) in dollars is shown on the vertical axis. The maximum relevant range of sales and total costs is $700,000.
The total sales line is drawn right upward by connecting the first point at $0 to the second point at $625,000
The total cost line is drawn right upward by connecting the first point at $75,000 (fixed cost) on the vertical axis to the second point at $512,500
The break-even point is the intersection point where the total sales line and total cost line meet. The vertical dotted line drawn downward from the intersection point reaches at 1,000 units. It indicates the break-even sales (units). The horizontal line drawn to the left towards the vertical axis reaches at $250,000. It indicates the break-even sales (dollars).
The operating profit area is the area where the total sales line exceeds the total cost line. However, the operating loss area is the area where the total cost exceeds the total sales line.
2(A)
The income from operations for last year
2(A)
Explanation of Solution
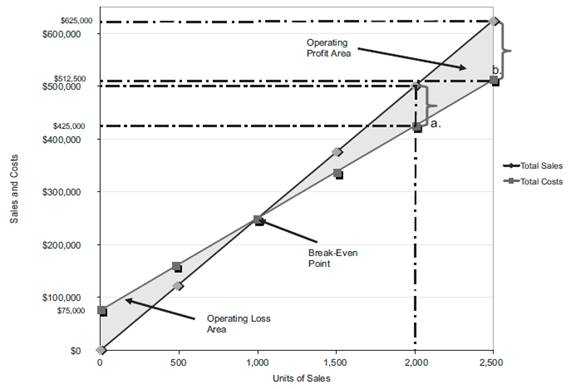
Figure (2)
Last year, the number of units sold is 2,000 units (3). The total sales is $500,000. The total cost is
Similarly, a dotted line is drawn from the total cost at $425,000 on the vertical axis towards the right and a dotted line is drawn upward for the 2,000 units sold from the horizontal axis. The two dotted line meet at a point which indicates the point of total cost at 2,000 units.
The dotted line from sales is above the dotted line for total cost. This indicates the income from operations. Thus, the area in between the two dotted lines is the income from operations of
2(B)
The maximum income from operations realized during the year.
2(B)
Explanation of Solution
The maximum relevant range for number of units to be sold is 2,500 units. Thus, the total sale is
Similarly, a dotted line is drawn from the total cost at $512,500 on the vertical axis towards the right and a dotted line is drawn upward for the 2,500 units sold from the horizontal axis. The two dotted line meet at a point which indicates the point of total cost at 2,500 units.
The dotted line from sales is above the dotted line for total cost. This indicates the income from operations. Thus, the area in between the two dotted lines is the income from operations of
2(A)
To verify: the answers using the mathematical approach to cost-volume-profit analysis.
2(A)
Explanation of Solution
Verify the answers using the mathematical approach to cost-volume-profit analysis.
Determine the income from operations for the last year.
| Determine the income from operations for 2,000 units | ||
| Particulars | Amount ($) | Amount ($) |
| Sales | 500,000 | |
| Less: Fixed costs | 75,000 | |
| Variable costs
|
350,000 | (425,000) |
| Income from operations | 75,000 | |
Table (1)
Working note:
Determine the number of units sold.
Sales =$500,000
Selling price per unit =$250 per unit
2(B)
the maximum income from operations that could have been realized during the year.
2(B)
Explanation of Solution
| Determine the income from operations for 2,500 units | ||
| Particulars | Amount ($) | Amount ($) |
| Sales
|
625,000 | |
| Less: Fixed costs | 75,000 | |
| Variable costs
|
437,500 | (512,500) |
| Income from operations | 112,500 | |
Table (2)
3.
To construct: a cost-volume-profit chart indicating the break-even sales for the current year.
3.
Explanation of Solution
Construct a cost-volume-profit chart indicating the break-even sales for the current year.
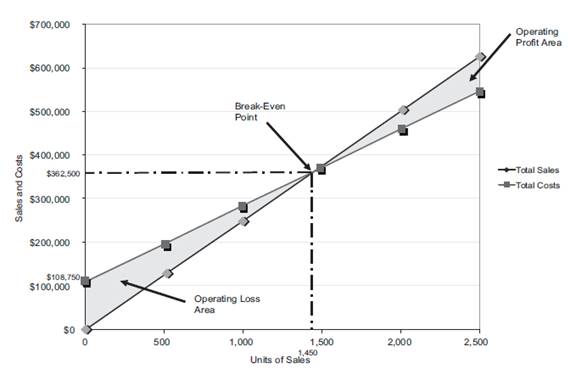
Figure (3)
The volume in units of sales is shown on the horizontal axis. The maximum relevant range is 2,500 units. The sales and the total costs (fixed cost and variable cost) in dollars is shown on the vertical axis. The maximum relevant range of sales and total costs is $700,000.
The total sales line is drawn right upward by connecting the first point at $0 to the second point at $625,000
The total cost line is drawn right upward by connecting the first point at
The break-even point is the intersection point where the total sales line and total cost line meet. The vertical dotted line drawn downward from the intersection point reaches at 1,450 units. It indicates the break-even sales (units). The horizontal line drawn to the left towards the vertical axis reaches at $362,500. It indicates the break-even sales (dollars).
The operating profit area is the area where the total sales line exceeds the total cost line. However, the operating loss area is the area where the total cost exceeds the total sales line.
4(A)
the income from operations for sales 2,000 units
4(A)
Explanation of Solution
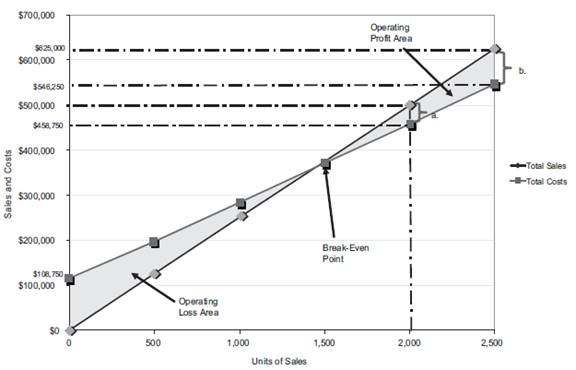
Figure (4)
Last year, the number of units sold is 2,000 units (3). The total sales is $500,000. The total cost is
Similarly, a dotted line is drawn from the total cost at $458,750 on the vertical axis towards the right and a dotted line is drawn upward for the 2,000 units sold from the horizontal axis. The two dotted line meet at a point which indicates the point of total cost at 2,000 units.
The dotted line from sales is above the dotted line for total cost. This indicates the income from operations. Thus, the area in between the two dotted lines is the income from operations of
4(B)
The maximum income from operations that could have been realized during the year.
4(B)
Explanation of Solution
The maximum relevant range for number of units to be sold is 2,500 units. Thus, the total sales is
Similarly, a dotted line is drawn from the total cost at $546,250 on the vertical axis towards the right and a dotted line is drawn upward for the 2,500 units sold from the horizontal axis. The two dotted line meet at a point which indicates the point of total cost at 2,500 units.
The dotted line from sales is above the dotted line for total cost. This indicates the income from operations. Thus, the area in between the two dotted lines is the income from operations of
4(A)
To verify: the answers using the mathematical approach to cost-volume-profit analysis.
4(A)
Explanation of Solution
Verify the answers using the mathematical approach to cost-volume-profit analysis.
Determine the income from operations for the last year.
| Determine the income from operations for 2,000 units | ||
| Particulars | Amount ($) | Amount ($) |
| Sales | 500,000 | |
| Less: Total Fixed costs
|
108,750 | |
| Variable costs
|
350,000 | (458,750) |
| Income from operations | 41,250 | |
Table (3)
4(B)
the maximum income from operations that could have been realized during the year.
4(B)
Explanation of Solution
| Determine the income from operations for 2,500 units | ||
| Particulars | Amount ($) | Amount ($) |
| Sales
|
625,000 | |
| Less: Total Fixed costs
|
108,750 | |
| Variable costs
|
437,500 | (546,250) |
| Income from operations | 78,750 | |
Table (4)
Want to see more full solutions like this?
Chapter 19 Solutions
CengageNOWv2, 2 terms Printed Access Card for Warren?s Financial & Managerial Accounting, 13th, 13th Edition

- Poleski Manufacturing, which maintains the same level of inventory at the end of each year, provided the following information about expenses anticipated for next year: The selling price of Poleskis single product is 16. In recent years, profits have fallen and Poleskis management is now considering a number of alternatives. Poleski wants to have a net income next year of 250,000, but expects to sell only 120,000 units unless some changes are made. The president of Poleski has asked you to calculate the companys projected net income (assuming 120,000 units are sold) and the sales needed to achieve the companys net income objective for next year. Also, compute Poleskis contribution margin per unit, contribution margin ratio, and break-even point for next year. The worksheet CVP has been provided to assist you. Note that the data from the problem have already been entered into the Data Section of the worksheet.arrow_forwardBreak-Even Sales and Cost-Volume-Profit Graph Last year, Ridgecrest Inc. had sales of $3,221,680, based on a unit selling price of $440. The variable cost per unit was $280, and fixed costs were $836,800. The maximum sales within Ridgecrest Inc.'s relevant range are 13,000 units. Ridgecrest Inc. is considering a proposal to spend an additional $168,000 on billboard advertising during the current year in an attempt to increase sales and utilize unused capacity. Using the cost-volume-profit graph prepared in part (1), determine (a) the operating income for last year and (b) the maximum operating income that could have been realized during the year. Operating income $ Maximum operating income $arrow_forwardLast year company A introduced a new product and sold 25,900 units at $97.00 per unit. The product variable expense $67.00 per unit with a fixed price expense of $835,500 per year. a. What is the product's net income or loss last year? b. What is the product break-even point in unit sales and dollar sales? c. Assume the company has conducted a market study that estimates it can increase sales by 5,000 units for each $2.00 reduction in its selling price. If the company would only consider increments of $2.00(e.g. $68,$66, etc) What is the maximum annual profit that can be earned on this product? What sales volume and selling price per unit generate the maximum profit? d. What would be the break-even point in unit sales and dollar sales using the selling price that was determined in the required letter c above? Thank you,arrow_forward
- Music Corporation recorded sales of $2,235,245 for the most recent year. The company's breakeven sales point (in dollars) is $1,650,000, and its margin of safety ratio (MOS%) at the current sales level is 26%. What sales (in dollars) would be needed to increase the company's MOS% to 38%? Multiple Choice $2,277,000. $2,661,290. $2,932,640. $3,024,050. $2,660,000.arrow_forwardProfit-Volume Chart For the coming year, Loudermilk Inc. anticipates fixed costs of $600,000, a unit variable cost of $75, and a unit selling price of $125. The maximum sales within the relevant range are $2,500,000. a. Determine the maximum possible operating loss. b. Compute the maximum possible operating profit. c. Construct a profit-volume chart on paper. Indicate whether each of the following levels of sales is in the operating profit area, operating loss area, or at the break-even point. 4,800 units 8,000 units 12,000 units 16,000 units 20,000 units d. Estimate the break-even sales (units) by using the profit-volume chart constructed in part (c). unitsarrow_forwardMinden Company introduced a new product last year for which it is trying to find an optimal selling price. Marketing studies suggest that the company can increase sales by 5,000 units for each $2 reduction in the selling price. The company’s present selling price is $95 per unit, and variable expenses are $65 per unit. Fixed expenses are $835,800 per year. The present annual sales volume (at the $95 selling price) is 25,900 units. 3. Assuming that the marketing studies are correct, what is the maximum annual profit that the company can earn? At how many units and at what selling price per unit would the company generate this profit? 4. What would be the break-even point in unit sales and in dollar sales using the selling price you determined in (3) above (e.g., the selling price at the level of maximum profits)arrow_forward
- Following is the last year data of X company: Selling price Variable expenses per unit $40 unit $80 per Fixed expenses for the year $180,000 The company sold 45,000-unit last year. Managers of X company believes that the sales can be doubled when expenditure on advertising is increased by $1.50 per unit, keeping the selling price same as last year. Determine the amount by which advertising can be increased with profits remaining unchanged? a. $1,665,000 b. $1,800,000 c. $1,500,000 d. $1,660,000arrow_forwardLast year Minden Company introduced a new product and sold 15,500 units at a price of $74 per unit. The product's variable expenses are $44 per unit and its fixed expenses are $517,800 per year. Required: 1. What was this product's net operating income (loss) last year? 2. What is the product's break-even point in unit sales and dollar sales? 3. Assume the company conducted a marketing study that estimates it can increase annual sales of this product by 5,000 units for each $2 reduction in its selling price. If the company will only consider price reductions in increments of $2 (e.g., $72, $70, etc.), what is the maximum annual profit it can earn on this product? What sales volume and selling price per unit generate the maximum profit? 4. What would be the break-even point in unit sales and dollar sales using the selling price you calculated in requirement 3?arrow_forwardLast year Minden Company Introduced a new product and sold 25,100 units of It at a price of $95 per unit. The product's varlable expenses are $65 per unit and its fixed expenses are $835,500 per year. Required: 1. What was this product's net operating Income (loss) last year? 2 What Is the product's break-even polnt in unit sales and dollar sales? 3. Assume the company has conducted a marketing study that estimates It can Increase annual sales of this product by 5.000 units for each $2 reduction In Its selling price. If the company will only consider price reductions in Increments of $2 (e.g. $68. $6, etc.). what is the maximum annual profit that It can earn on this product? What sales volume and selling price per unit generate the maximum profit? 4. What would be the break-even polnt In unit sales and In dollar sales using the selling price that you determined In requirement 3? Complete this question by entering your answers in the tabs below. Required 1 Required 2 Required 3 Required…arrow_forward
- Last year Minden Company introduced a new product and sold 25,500 units of it at a price of $99 per unit. The product's variable expenses are $69 per unit and its fixed expenses are $836,400 per year. Required: 1. What was this product's net operating income (loss) last year? 2. What is the product's break-even point in unit sales and dollar sales? 3. Assume the company has conducted a marketing study that estimates it can increase annual sales of this product by 5,000 units for each $2 reduction in its selling price. If the company will only consider price reductions in increments of $2 (e.g., $68, $66, etc.), what is the maximum annual profit that it can earn on this product? What sales volume and selling price per unit generate the maximum profit? 4. What would be the break-even point in unit sales and in dollar sales using the selling price that you determined in requirement 3? subpart number 4arrow_forwardLast year Minden Company introduced a new product and sold 25,500 units of it at a price of $99 per unit. The product's variable expenses are $69 per unit and its fixed expenses are $836,400 per year. Required: 1. What was this product's net operating income (loss) last year? 2. What is the product's break-even point in unit sales and dollar sales? 3. Assume the company has conducted a marketing study that estimates it can increase annual sales of this product by 5,000 units for each $2 reduction in its selling price. If the company will only consider price reductions in increments of $2 (e.g., $68, $66, etc.), what is the maximum annual profit that it can earn on this product? What sales volume and selling price per unit generate the maximum profit? 4. What would be the break-even point in unit sales and in dollar sales using the selling price that you determined in requirement 3?arrow_forwardLast year Minden Company introduced a new product and sold 25,800 units of it at a price of $95 per unit. The product's variable expenses are $65 per unit and its fixed expenses are $830,400 per year. Required: 1. What was this product's net operating income (loss) last year? 2. What is the product's break-even point in unit sales and dollar sales? 3. Assume the company has conducted a marketing study that estimates it can increase annual sales of this product by 5,000 units for each $2 reduction in its selling price. If the company will only consider price reductions in increments of $2 (e.g., $68, $66, etc.), what is the maximum annual profit that it can earn on this product? What sales volume and selling price per unit generate the maximum profit? 4. What would be the break-even point in unit sales and in dollar sales using the selling price that you determined in requirement 3? Complete this question by entering your answers in the tabs below. Required 1 Required 2 Required 3…arrow_forward
 Managerial AccountingAccountingISBN:9781337912020Author:Carl Warren, Ph.d. Cma William B. TaylerPublisher:South-Western College Pub
 Cornerstones of Cost Management (Cornerstones Ser...AccountingISBN:9781305970663Author:Don R. Hansen, Maryanne M. MowenPublisher:Cengage Learning
 Excel Applications for Accounting PrinciplesAccountingISBN:9781111581565Author:Gaylord N. SmithPublisher:Cengage Learning