Concept explainers
Videos
Interpretation:
Scatchard plot has to be prepared and value of K along with the fraction of saturation for the data has to be given.
Concept Introduction:
Scatchard plot:
The equilibrium constant can be measured by measuring the concentration of the species at equilibrium.
Consider, a species P reacting with ligand X to form PX
Neglect the activity coefficients, we get,
Suppose a series of solutions increments of X are added to a constant volume of P.
Let
The expression for equilibrium can be rearranged as below,
A graph of
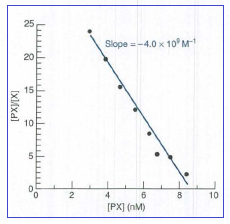
Figure 1
To prepare Scatchard plot
To calculate the value of K along with the fraction of saturation
Want to see the full answer?
Check out a sample textbook solution
Chapter 19 Solutions
Quantitative Chemical Analysis


 ChemistryChemistryISBN:9781305957404Author:Steven S. Zumdahl, Susan A. Zumdahl, Donald J. DeCostePublisher:Cengage Learning
 ChemistryChemistryISBN:9781259911156Author:Raymond Chang Dr., Jason Overby ProfessorPublisher:McGraw-Hill Education
 Principles of Instrumental AnalysisChemistryISBN:9781305577213Author:Douglas A. Skoog, F. James Holler, Stanley R. CrouchPublisher:Cengage Learning
 Organic ChemistryChemistryISBN:9780078021558Author:Janice Gorzynski Smith Dr.Publisher:McGraw-Hill Education
 Chemistry: Principles and ReactionsChemistryISBN:9781305079373Author:William L. Masterton, Cecile N. HurleyPublisher:Cengage Learning
 Elementary Principles of Chemical Processes, Bind...ChemistryISBN:9781118431221Author:Richard M. Felder, Ronald W. Rousseau, Lisa G. BullardPublisher:WILEY