
Statistics for Management and Economics (Book Only)
11th Edition
ISBN: 9781337296946
Author: Gerald Keller
Publisher: Cengage Learning
expand_more
expand_more
format_list_bulleted
Question
Chapter 19, Problem 118CE
To determine
Test the hypothesis.
Expert Solution & Answer
Explanation of Solution
The null hypothesis (H0) is
The Spearman rank correlation output is obtained using the statistical software. The result is given below:
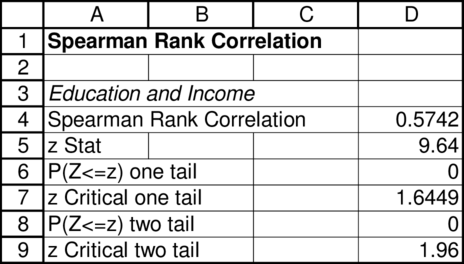
The z value is 9.64 and the p value is 0. Since the p value is equal to 0, the alternate hypothesis is accepted.
Want to see more full solutions like this?
Subscribe now to access step-by-step solutions to millions of textbook problems written by subject matter experts!
Students have asked these similar questions
OA large city hospital conducted a study to investigate the relationship between the number of unauthorized days that employees are absent per year and the
distance (miles) between home and work for the employees. A sample of 10 employees was selected and the following data were collected.
D Excel file: data14-13.xlsx
Distance to Work
Number of Days
(miles)
Absent
8.
8.
9.
8
6.
10
12
14
14
4
18
If required, enter negative values as negative numbers.
a. Select the correct scatter diagram for these data.
A.
Number of Days Absent
10+
8+ .
6-
2+
8.
10
12
14
16
18
20
Distance to Work (miles)
4.
The measurement of the number of people who are willing to work, capable of working, and who have jobs that fit their skills is called:
X1=80 X2=180 A=400 B=200
Chapter 19 Solutions
Statistics for Management and Economics (Book Only)
Ch. 19.1 - Prob. 1ECh. 19.1 - Prob. 2ECh. 19.1 - Prob. 3ECh. 19.1 - Prob. 4ECh. 19.1 - Prob. 5ECh. 19.1 - Prob. 6ECh. 19.1 - Prob. 7ECh. 19.1 - Prob. 8ECh. 19.1 - Prob. 9ECh. 19.1 - Prob. 10E
Ch. 19.1 - Prob. 11ECh. 19.1 - Prob. 12ECh. 19.1 - Prob. 13ECh. 19.1 - Prob. 14ECh. 19.1 - Prob. 15ECh. 19.1 - Prob. 16ECh. 19.1 - Prob. 17ECh. 19.1 - Prob. 18ECh. 19.1 - Prob. 19ECh. 19.1 - Prob. 20ECh. 19.1 - Prob. 21ECh. 19.1 - Prob. 22ECh. 19.1 - Prob. 23ECh. 19.1 - Prob. 24ECh. 19.1 - Prob. 25ECh. 19.1 - Prob. 26ECh. 19.1 - Prob. 27ECh. 19.1 - Prob. 28ECh. 19.1 - Prob. 29ECh. 19.1 - Prob. 30ECh. 19.1 - Prob. 31ECh. 19.1 - Prob. 32ECh. 19.1 - Prob. 33ECh. 19.1 - Prob. 34ECh. 19.2 - Prob. 35ECh. 19.2 - Prob. 36ECh. 19.2 - Prob. 37ECh. 19.2 - Prob. 38ECh. 19.2 - Prob. 39ECh. 19.2 - Prob. 40ECh. 19.2 - Prob. 41ECh. 19.2 - Prob. 42ECh. 19.2 - Prob. 43ECh. 19.2 - Prob. 44ECh. 19.2 - Prob. 45ECh. 19.2 - Prob. 46ECh. 19.2 - Prob. 47ECh. 19.2 - Prob. 48ECh. 19.2 - Prob. 49ECh. 19.2 - Prob. 50ECh. 19.2 - Prob. 51ECh. 19.2 - Prob. 52ECh. 19.2 - Prob. 53ECh. 19.2 - Prob. 54ECh. 19.2 - Prob. 55ECh. 19.2 - Prob. 56ECh. 19.2 - Prob. 57ECh. 19.2 - Prob. 58ECh. 19.2 - Prob. 59ECh. 19.3 - Prob. 60ECh. 19.3 - Prob. 61ECh. 19.3 - Prob. 62ECh. 19.3 - Prob. 63ECh. 19.3 - Prob. 64ECh. 19.3 - Prob. 65ECh. 19.3 - Prob. 66ECh. 19.3 - Prob. 67ECh. 19.3 - Prob. 68ECh. 19.3 - Prob. 69ECh. 19.3 - Prob. 70ECh. 19.3 - Prob. 71ECh. 19.3 - Prob. 72ECh. 19.3 - Prob. 73ECh. 19.3 - Prob. 74ECh. 19.3 - Prob. 75ECh. 19.3 - Prob. 76ECh. 19.3 - Prob. 77ECh. 19.3 - Prob. 78ECh. 19.3 - Prob. 79ECh. 19.3 - Prob. 80ECh. 19.3 - Prob. 81ECh. 19.3 - Prob. 82ECh. 19.3 - Prob. 83ECh. 19.3 - Prob. 84ECh. 19.3 - Prob. 85ECh. 19.3 - Prob. 86ECh. 19.3 - Prob. 87ECh. 19.3 - Prob. 88ECh. 19.3 - Prob. 89ECh. 19.3 - Prob. 90ECh. 19.3 - Prob. 91ECh. 19.3 - Prob. 92ECh. 19.3 - Prob. 93ECh. 19.4 - Prob. 94ECh. 19.4 - Prob. 95ECh. 19.4 - Prob. 96ECh. 19.4 - Prob. 97ECh. 19.4 - Prob. 98ECh. 19.4 - Prob. 99ECh. 19.4 - Prob. 100ECh. 19.4 - Prob. 101ECh. 19.4 - Prob. 102ECh. 19.4 - Prob. 103ECh. 19.4 - Prob. 104ECh. 19.4 - Prob. 105ECh. 19.4 - Prob. 106ECh. 19.4 - Prob. 107ECh. 19.4 - Prob. 108ECh. 19.4 - Prob. 109ECh. 19.4 - Prob. 110ECh. 19.4 - Prob. 111ECh. 19.4 - Prob. 112ECh. 19.4 - Prob. 113ECh. 19.4 - Prob. 114ECh. 19.4 - Prob. 115ECh. 19.4 - Prob. 116ECh. 19.4 - Prob. 117ECh. 19.A - Prob. 1ECh. 19.A - Prob. 2ECh. 19.A - Prob. 3ECh. 19.A - Prob. 4ECh. 19.A - Prob. 5ECh. 19.A - Prob. 6ECh. 19.A - Prob. 7ECh. 19.A - Prob. 8ECh. 19.A - Prob. 9ECh. 19.A - Prob. 10ECh. 19.A - Prob. 11ECh. 19.A - Prob. 12ECh. 19.A - Prob. 13ECh. 19.A - Prob. 14ECh. 19.A - Prob. 15ECh. 19.A - Prob. 16ECh. 19.A - Prob. 17ECh. 19.A - Prob. 18ECh. 19.A - Prob. 19ECh. 19.A - Prob. 20ECh. 19.A - Prob. 21ECh. 19.A - Prob. 22ECh. 19.A - Prob. 23ECh. 19.A - Prob. 24ECh. 19.A - Prob. 25ECh. 19.A - Prob. 26ECh. 19.A - Prob. 27ECh. 19.A - Prob. 28ECh. 19.A - Prob. 29ECh. 19.A - Prob. 30ECh. 19.A - Prob. 31ECh. 19.A - Prob. 32ECh. 19.A - Prob. 33ECh. 19.A - Prob. 34ECh. 19.A - Prob. 35ECh. 19.A - Prob. 36ECh. 19.A - Prob. 37ECh. 19.A - Prob. 38ECh. 19.A - Prob. 39ECh. 19.A - Prob. 40ECh. 19.A - Prob. 41ECh. 19.A - Prob. 42ECh. 19.A - Prob. 43ECh. 19.A - Prob. 44ECh. 19.A - Prob. 45ECh. 19.A - Prob. 46ECh. 19.A - Prob. 47ECh. 19.A - Prob. 48ECh. 19.A - Prob. 49ECh. 19 - Prob. 118CECh. 19 - Prob. 119CECh. 19 - Prob. 120CECh. 19 - Prob. 121CECh. 19 - Prob. 122CECh. 19 - Prob. 123CECh. 19 - Prob. 124CECh. 19 - Prob. 125CECh. 19 - Prob. 126CECh. 19 - Prob. 127CECh. 19 - Prob. 128CECh. 19 - Prob. 129CECh. 19 - Prob. 130CECh. 19 - Prob. 131CECh. 19 - Prob. 132CECh. 19 - Prob. 133CECh. 19 - Prob. 134CECh. 19 - Prob. 135CECh. 19 - Prob. 136CECh. 19 - Prob. 137CECh. 19 - Prob. 138CECh. 19 - Prob. 139CE
Knowledge Booster

Similar questions
- You need to research about (Personal finance management) using a sample . Describe the steps to be taken in order to use the stratified sampling technique .arrow_forwardThe latest Gallup poll shows that 63 percent of Americans felt that the laws covering the sales of firearms should be made more strict, 29 percent felt that the laws should be less strict, and 7 percent felt that the laws should be less restrict. Suppose the survey were conducted among 2,000 individuals. i. What is the population for this survey? ii. What constitutes the sample?arrow_forwardThe birthweight (in kg) of 55 babies are tabulated in the frequency distribution below: Birthweight (kg) Class Midpoint Frequency M (1– 1.5| (1.5-2 1.25 6. 1.75 10 (2- 2.5) 2.25 1 (2.5-3) 2.75 15 10 (3-3.5] 3.25 3. (3.5- 4) 3.75 55 Total Calculate the relative frequency of the class interval (2 - 2.5).arrow_forward
- 2. Based on past records, it is generally believed that on an average, a typical University of Technology and Applied Sciences, Nizwa student spends about 25 hours in the LRC per week. Recently, the library has been shifted to a new location which is further away from the academic block. As a result, the administration feels that students may be spending less time in the library. Accordingly a random sample of 41 students were selected and the average number of hours they spend in the library came out to be 16.78 with a standard deviation of 5.17. Carry out an appropriate test of hypotheses for the above problem to test whether the shifting of the library has adversely impacted the study time in the population of all students. (You may assume that study times/week approximately follow a normal distribution in the population).arrow_forwardIn the following scenario what is the population and sample. In a study of Monarch butterflies, 55 milkweed plants in a Yosemite Valle were randomly sampled. The average number of Monarch eggs per plant was 0.73. [ Select ] The population of interest is [ Select ] The sample is MacBook Pro 888 ::: 23 & 4 6. 7 E R T Y U F G H J K C V comman V - * 00arrow_forwardA life insurance company wishes to examine the relationship between the amount of life insurance held by a family and family income. From a random sample of households, the company collected the accompanying INCOME 97 INSUR 38 data. The data are in units of thousands of dollars. INSUR 141 29 Let y = 280 75 X = INCOME 303 81 453 137 357 77 199 43 251 53 807 184 147 45 272 70 537 128 527 117 245 55 483 116 673 204 194 46 154 51 163 48 280 69 507 140 464 136 321 71 873 206 476 144 574 111 251 65 497 130 826 171 133 32 259 82 281 73 446 146 3 The vertical intercept of the estimated regression equation is 332 77 a 11.009 219 48 b 9.830 208 55 8.776 180 48 d 7.836 169 42 273 69 502 127 547 126 281 80 428 143 370 77 221 49 214 51arrow_forward
- 45 people were surveyed at the Sunway Pyramid Mall to investigate coffee preferences. The results of the survey are recorded below. Coffee Type Children Adults Seniors Latte 3 ? Mocha 9 11 a) Determine how many Seniors prefer Latte? Show your work. [A: 1 mark] Your answer locs.google.com/forms/d/e/1FAlpQLSewitqD60pXbHRrH-dmFwuvBFgFL6CNyPNFCrDm7uMzq5u8-A/formResponse 022, 13:32 MDM4U Unit 2 Test 2022S1 Draw and upload the Stacked Split Bar graph * b) Create a Split bar graph for Coffee Type. Include all titles and labels. [A: 4 marks] Legendarrow_forwardThe table below shows a stem-and-leaf diagram for the test scores of students in Liberal Arts Math. Stems 56 78 7 9 Leaves 78 3478 034459 002257 56 How many students took the test? What is the lowest score on the test?arrow_forwardNote: If your answer does not exactly match the correct choice, it is due to rounding of intermediate calculations. To avoid the discrepancy, do your calculations in Excel without rounding. A life insurance company wishes to examine the relationship between the amount of life insurance held by a family and family income. From a random sample of households, the company collected the accompanying data. The data are in units of thousands of dollars. INSUR INCOME 97 38 141 29 y = X = Let INSUR 280 75 %3D INCOME 303 81 453 137 357 77 199 43 251 53 807 184 147 45 272 70 537 128 527 117 245 55 483 116 673 204 194 46 154 51 163 48 2 The denominator of the slope coefficient formula for the estimated regression equation is: 108,450.87 280 69 a 507 140 b 105,805.73 464 136 103,225.10 321 71 d 100,707.41 873 206 476 144 574 111 251 65 497 130 826 171 133 32 259 82 281 73 446 146 332 77 219 48 208 55 180 48 169 42 273 69 502 127 547 126 281 80 428 143 370 77 221 49 214 51arrow_forward
- 6. Imagine that I wanted to test the proposition that people think older politicians are more trustworthy. I recruited an internet sample of 90 people. Each person was asked to read a short article about a hypothetical political candidate. Random assignment determined whether the subjects were told that candidate was 65 or whether they were told that candidate was 35. After reading the article, all subjects used a 10-point scale to rate the candidate on competence, trustworthiness, and likability. I take the mean values of trustworthiness in each group, perform a difference of means test, and find a test statistic of 1.04. Should I reject the null at the 99% confidence level? Why or why not? What does that mean?arrow_forwardA CBS News poll involved a nationwide random sample of 651 adults, asked those adults about their party affiliation (Democrat, Republican or none) and their opinion of how the US economy was changing ("getting better," "getting worse" or "about the same"). The results are shown in the table below. If we randomly select one of the adults who participated in this study, compute: (round to four decimal places)a.P(affiliated with neither party) = b.P(better) = c.P(better|affiliated with neither party) = d.P(affiliated with neither party|better) = e.P(affiliated with neither party and better) =arrow_forwardMany investors and financial analysts believe the Dow Jones Industrial Average (DJIA) gives a good barometer of the overall stock market. On January 31, 2006, 9 of the 30 stocks making up the DJIA increased in price (The Wall Street Journal, February 1, 2006). On the basis of this fact, a financial analyst claims we can assume that 30% of the stocks traded on the New York Stock Exchange (NYSE) went up the same day.A sample of 70 stocks traded on the NYSE that day showed that 31 went up.You are conducting a study to see if the proportion of stocks that went up is is significantly more than 0.3. You use a significance level of α=0.002α=0.002.What is the test statistic for this sample? (Report answer accurate to three decimal places.)test statistic = What is the p-value for this sample? (Report answer accurate to four decimal places.)p-value = The p-value is... less than (or equal to) αα greater than αα This test statistic leads to a decision to... reject the null accept the null…arrow_forward
arrow_back_ios
SEE MORE QUESTIONS
arrow_forward_ios
Recommended textbooks for you

 Principles of Economics (12th Edition)EconomicsISBN:9780134078779Author:Karl E. Case, Ray C. Fair, Sharon E. OsterPublisher:PEARSON
 Engineering Economy (17th Edition)EconomicsISBN:9780134870069Author:William G. Sullivan, Elin M. Wicks, C. Patrick KoellingPublisher:PEARSON
 Principles of Economics (MindTap Course List)EconomicsISBN:9781305585126Author:N. Gregory MankiwPublisher:Cengage Learning
 Managerial Economics: A Problem Solving ApproachEconomicsISBN:9781337106665Author:Luke M. Froeb, Brian T. McCann, Michael R. Ward, Mike ShorPublisher:Cengage Learning
 Managerial Economics & Business Strategy (Mcgraw-...EconomicsISBN:9781259290619Author:Michael Baye, Jeff PrincePublisher:McGraw-Hill Education
Principles of Economics (12th Edition)
Economics
ISBN:9780134078779
Author:Karl E. Case, Ray C. Fair, Sharon E. Oster
Publisher:PEARSON
Engineering Economy (17th Edition)
Economics
ISBN:9780134870069
Author:William G. Sullivan, Elin M. Wicks, C. Patrick Koelling
Publisher:PEARSON
Principles of Economics (MindTap Course List)
Economics
ISBN:9781305585126
Author:N. Gregory Mankiw
Publisher:Cengage Learning
Managerial Economics: A Problem Solving Approach
Economics
ISBN:9781337106665
Author:Luke M. Froeb, Brian T. McCann, Michael R. Ward, Mike Shor
Publisher:Cengage Learning
Managerial Economics & Business Strategy (Mcgraw-...
Economics
ISBN:9781259290619
Author:Michael Baye, Jeff Prince
Publisher:McGraw-Hill Education