Videos
(a)
The P-V diagram.
(a)
Answer to Problem 77P
The P-V diagram is shown in figure 1.
Explanation of Solution
Calculation:
Consider the given data, the pressure versus volume graph for the process is shown below.
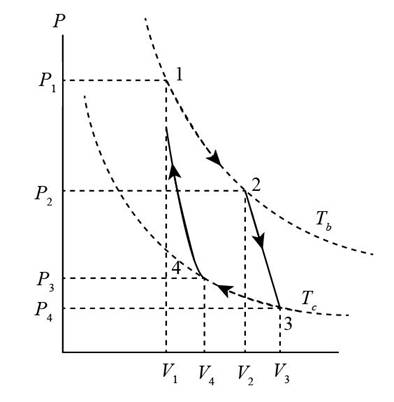
Figure 1
Conclusion:
Therefore, the P-V diagram is shown in figure 1.
(b)
The proof that
(b)
Answer to Problem 77P
It is proved that
Explanation of Solution
Formula used:
The expression for heat absorbed is given by,
The expression for work done is given by,
Calculation:
The heat absorbed is calculated as,
Conclusion:
Therefore, it is proved that
(c)
The proof that
(c)
Answer to Problem 77P
It is proved that
Explanation of Solution
Formula used:
The expression for heat absorbed is given by,
The expression for work done is given by,
Calculation:
The heat absorbed is calculated as,
Conclusion:
Therefore, it is proved that
(d)
The proof that
(d)
Answer to Problem 77P
It is proved that
Explanation of Solution
Formula used:
The expression for quasistatic adiabatic process at point 4 is given by,
The expression for quasistatic adiabatic process at point 2 and 3 is given by,
Calculation:
The expression for quasistatic adiabatic process at point 4 is given by,
The expression for quasistatic adiabatic process at point 2 and 3 is given by,
Conclusion:
Therefore, it is proved that
(e)
The proof that efficiency is
(e)
Answer to Problem 77P
It is proved that efficiency is
Explanation of Solution
Formula used:
The expression for efficiency is given by,
The expression for work done is given by,
Calculation:
The efficiency is calculated as,
Conclusion:
Therefore, it is proved that efficiency is
(f)
The proof that
(f)
Answer to Problem 77P
It is proved that
Explanation of Solution
Formula used:
The expression for heat is given by,
Calculation:
The ratio of
Conclusion:
Therefore, it is proved that
Want to see more full solutions like this?
Chapter 18 Solutions
Physics for Scientists and Engineers


- A sample of a monatomic ideal gas occupies 5.00 L at atmospheric pressure and 300 K (point A in Fig. P17.68). It is warmed at constant volume to 3.00 atm (point B). Then it is allowed to expand isothermally to 1.00 atm (point C) and at last compressed isobarically to its original state. (a) Find the number of moles in the sample. Find (b) the temperature at point B, (c) the temperature at point C, and (d) the volume at point C. (e) Now consider the processes A B, B C, and C A. Describe how to carry out each process experimentally. (f) Find Q, W, and Eint for each of the processes. (g) For the whole cycle A B C A, find Q, W, and Eint. Figure P17.68arrow_forwardA sample of a monatomic ideal gas occupies 5.00 L at atmospheric pressure and 300 K (point A in Fig. P21.65). It is warmed at constant volume to 3.00 atm (point B). Then it is allowed to expand isothermally to 1.00 atm (point C) and at last compressed isobarically to its original state, (a) Find the number of moles in the sample. Find (b) the temperature at point B, (c) the temperature at point C, and (d) the volume at point C. (e) Now consider the processes A B, B C, and C A. Describe how to carry out each process experimentally, (f) Find Q, W, and Eint for each of the processes, (g) For the whole cycle A B C A, find Q, W, and Eint.arrow_forwardA 2.00-mol sample of a diatomic ideal gas expands slowly and adiabatically from a pressure of 5.00 atm and a volume of 12.0 L to a final volume of 30.0 L. (a) What is the final pressure of the gas? (b) What are the initial and final temperatures? Find (c) Q, (d) Eint, and (e) W for the gas during this process.arrow_forward
- An ideal gas initially at 300 K undergoes an isobaric expansion at 2.50 kPa. If the volume increases from 1.00 m3 to 3.00 m3 and 12.5 kJ is transferred to the gas by heat, what are (a) the change in its internal energy and (b) its final temperature?arrow_forwardAn ideal gas has a pressure of 0.50 atm and a volume of 10 L. It is compressed adiabatically and quasi-statically until its pressure is 3.0 atm and its volume is 2.8 L. Is the monatomic, diatomic, or polyatomic?arrow_forwardWhen a gas undergoes an adiabatic expansion, which of the following statements is true? (a) The temperature of the gas does not change. (b) No work is done by the gas. (c) No energy is transferred to the gas by heat. (d) The internal energy of the gas does not change. (e) The pressure increases.arrow_forward
- A 4.00-L sample of a diatomic ideal gas with specific heat ratio 1.40, confined to a cylinder, is carried through a closed cycle. The gas is initially at 1.00 atm and 300 K. First, its pressure is tripled under constant volume. Then, it expands adiabatically to its original pressure. Finally, the gas is compressed isobarically to its original volume. (a) Draw a PV diagram of this cycle. (b) Determine the volume of the gas at the end of the adiabatic expansion. (c) Find the temperature of the gas at the start of the adiabatic expansion. (d) Find the temperature at the end of the cycle. (e) What was the net work done on the gas for this cycle?arrow_forwardAn ideal gas with specific heat ratio confined to a cylinder is put through a closed cycle. Initially, the gas is at Pi, Vi, and Ti. First, its pressure is tripled under constant volume. It then expands adiabatically to its original pressure and finally is compressed isobarically to its original volume. (a) Draw a PV diagram of this cycle. (b) Determine the volume at the end of the adiabatic expansion. Find (c) the temperature of the gas at the start of the adiabatic expansion and (d) the temperature at the end of the cycle. (e) What was the net work done on the gas for this cycle?arrow_forwardFigure P21.45 shows a cyclic process ABCDA for 1.00 mol of an ideal gas. The gas is initially at Pi = 1.50 105 Pa, Vi = 1.00 103 m3 (point A in Fig. P21.45). a. What is the net work done on the gas during the cycle? b. What is the net amount of energy added by heat to this gas during the cycle? FIGURE P21.45arrow_forward
- One mole of an ideal gas does 3 000 J of work on its surroundings as it expands isothermally to a final pressure of 1.00 atm and volume of 25.0 L. Determine (a) the initial volume and (b) the temperature of the gas.arrow_forwardThe arrow OA in the PV diagram shown in Figure OQ22.11 represents a reversible adiabatic expansion of an ideal gas. The same sample of gas, starting from the same state O. now undergoes an adiabatic free expansion to the same final volume. What point on the diagram could represent the final state of the gas? (a) the same point A as for the reversible expansion (b) point B (c) point C (d) any of those choices (e) none of those choicesarrow_forwardCylinder A contains oxygen (O2) gas, and cylinder B contains nitrogen (N2) gas. If the molecules in the two cylinders have the same rms speeds, which of the following statements is false? (a) The two gases haw different temperatures. (b) The temperature of cylinder B is less than the temperature of cylinder A. (c) The temperature of cylinder B is greater than the temperature of cylinder A. (d) The average kinetic energy of the nitrogen molecules is less than the average kinetic energy of the oxygen molecules.arrow_forward
 Physics for Scientists and Engineers: Foundations...PhysicsISBN:9781133939146Author:Katz, Debora M.Publisher:Cengage Learning
 Principles of Physics: A Calculus-Based TextPhysicsISBN:9781133104261Author:Raymond A. Serway, John W. JewettPublisher:Cengage Learning
 Physics for Scientists and Engineers, Technology ...PhysicsISBN:9781305116399Author:Raymond A. Serway, John W. JewettPublisher:Cengage Learning