
Statistics for Management and Economics (Book Only)
11th Edition
ISBN: 9781337296946
Author: Gerald Keller
Publisher: Cengage Learning
expand_more
expand_more
format_list_bulleted
Question
Chapter 18, Problem 43CE
a:
To determine
Regression equation.
a:
Expert Solution
Explanation of Solution
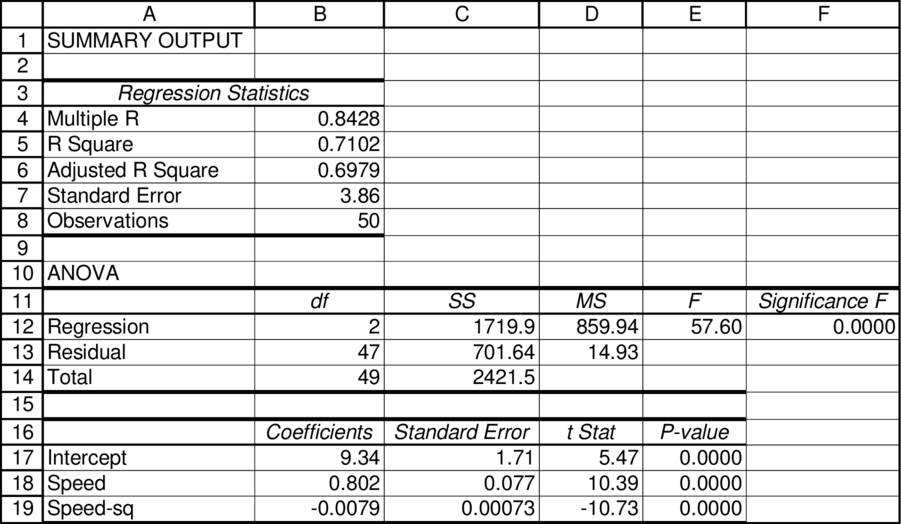
The general regression line can be derived as follows:
The intercept is denoted by IC and the coefficient is denoted by CE.
Mileage is determined by the speed. Substitute the respective value in Equation (1) to derive the regression equation.
b:
To determine
Regression process.
b:
Expert Solution
Explanation of Solution
The regression output is obtained using the statistical software. The result is as given below:
c:
To determine
Fitness of the model.
c:
Expert Solution
Explanation of Solution
The standard error is 3.86 and
Want to see more full solutions like this?
Subscribe now to access step-by-step solutions to millions of textbook problems written by subject matter experts!
Students have asked these similar questions
xt:Bong-Cha is deciding what to do during the 30-minute break between her college classes. One rule she could follow is, "Choose the activity with the highest value" (A). Another rule she could follow is, "Choose the activity with the lowest opportunity cost" (B). Do you think Bong-Cha's choice if she follows rule (A) will be the same as the choice she would make if she followed rule (B)? [another way to think about it, "Is rule (A) identical to rule (B) in a sense that they would both induce the same choice?"].
According to Wine-Searcher, wine critics generally use a wine-scoring scale to communicate their opinions on the relative quality of wines. Wine scores range
from 0 to 100, with a score of 95 – 100 indicating a great wine, 90 – 94 indicating an outstanding wine, 85 – 89 indicating a very good wine, 80 – 84
indicating a good wine, 75 - 79 indicating a mediocre wine, and below 75 indicating that the wine is not recommended. Random ratings of a pinot noir recently
produced by a newly established vineyard in 2018 follow:
Excel File: data07-11.xlsx
87
91
86
82
72
91
60
77
80
79
83
96
a. Develop a point estimate of mean wine score for this pinot noir (to 2 decimals).
b. Develop a point estimate of the standard deviation for wine scores received by this pinot noir (to 4 decimals).
Why can we not use first differences when we have independent cross sections in two years (as opposed to panel data)?
Chapter 18 Solutions
Statistics for Management and Economics (Book Only)
Ch. 18.1 - Prob. 1ECh. 18.1 - Prob. 2ECh. 18.1 - Prob. 3ECh. 18.1 - Prob. 4ECh. 18.1 - Prob. 5ECh. 18.1 - Prob. 6ECh. 18.1 - Prob. 7ECh. 18.1 - Prob. 8ECh. 18.1 - Prob. 9ECh. 18.1 - Prob. 10E
Ch. 18.2 - Prob. 11ECh. 18.2 - Prob. 12ECh. 18.2 - Prob. 13ECh. 18.2 - Prob. 14ECh. 18.2 - Prob. 15ECh. 18.2 - Prob. 16ECh. 18.2 - Prob. 17ECh. 18.2 - Prob. 18ECh. 18.2 - Prob. 19ECh. 18.2 - Prob. 20ECh. 18.2 - Prob. 21ECh. 18.2 - Prob. 22ECh. 18.2 - Prob. 23ECh. 18.2 - Prob. 24ECh. 18.2 - Prob. 25ECh. 18.2 - Prob. 26ECh. 18.2 - Prob. 27ECh. 18.2 - Prob. 28ECh. 18.2 - Prob. 29ECh. 18.2 - Prob. 30ECh. 18.2 - Prob. 31ECh. 18.2 - Prob. 32ECh. 18.2 - Prob. 33ECh. 18.3 - Prob. 34ECh. 18.3 - Prob. 35ECh. 18.3 - Prob. 36ECh. 18.3 - Prob. 37ECh. 18.4 - Prob. 38ECh. 18.4 - Prob. 39ECh. 18.4 - Prob. 40ECh. 18.4 - Prob. 41ECh. 18.4 - Prob. 42ECh. 18 - Prob. 43CECh. 18 - Prob. 44CECh. 18 - Prob. 45CECh. 18 - Prob. 46CECh. 18 - Prob. 47CECh. 18 - Prob. 48CECh. 18 - Prob. 49CE
Knowledge Booster

Similar questions
- A researcher investigated whether a father's level of optimism was predictive of his son's optimism as a young adult. Twenty (20) fathers and sons who agreed to participate in the study were administered a scale measuring their current level of optimism (the scale ranged from 10 to 50), with higher scores indicating greater optimism.arrow_forwardThe Watch Corporation of Switzerland claims that its watches on average will neither gain nor lose time during a week. A sample of 18 watches provided the following gains (+) or losses (-) in seconds per week +0.42 -e.35 0.12 e.59 0.21 0. 59 -0.71 e.74 0.62 -0.89 0.69 -0.67 0.30 -0.40 -0.36 0.54 0.41 0.74 Ho H=0 Is it reasonable to conclude that the mean gain or loss in time for the watches is 0? Use the 010 significance level. a. At a level of 0.10 significance, we reject Ho: µ = 0. (Negative answer should be indicated by a minus sign. Round the final answers to 3 decimal places.) If r reject Ho b. What is the value of the test statistic? (Round the final answer to 3 decimal places.) Value of the test statistic =arrow_forwardYou can adjust the values in the accompanying table for fields with white backgrounds. Once you have selected a field, you can either enter a new value or adjust the existing value by selecting the arrows (+ to increase and to decrease). You can exit the entry field by hitting Enter (or Return) on your keyboard or by selecting a place elsewhere on the problem. To reset a field to its starting value, select the circular refresh arrow that appears next to the selected field. Experiment with entering different values in the editable fields. Observe what changes take place on the graph itself and also in the uneditable fields in the table. Don't worry about understanding the economics behind the question, just make sure you understand how to manipulate the values on the graph. PRICE (Dollars per pair) 50 45 40 35 30 25 20 15 10 5 0 0 Supply 15 30 45 60 75 90 105 120 135 150 QUANTITY (Thousands of pairs of loafers) Entering 45.00 into the Price field Entering 40.00 into the Price of…arrow_forward
- This question was rejected because the screenshot was not clear. I took two screenshots of the same homework question. Please let me know if it is still unclear.arrow_forwardYou must identify the relationship between housing price and size. In this experiment, you have collected data from four major cities, namely Birmingham, Manchester, Bristol and Glasgow. What method is suitable for studying this project? Give an explanation.arrow_forwardNumber of Scenario Firms Type of Product Market Model A large city has lots of small shops where people can buy sweaters. Each store's sweaters reflect the style of that particular store. Additionally, some stores use higher-quality yarn than others, which is reflected in their price. Dozens of companies produce plain white socks. Consumers regard plain white socks as identical and don't care about who sells them their socks. The technology for producing socks is widely known, and any reputable person who wanted to start a sock manufacturing business could obtain a loan from a bank to buy the necessary machinery. In a large city, two taxi companies own all the licenses that the city will grant to operate taxis. Consumers don't care which cab company they take-if they decide it's worth taking a cab, they flag down the nearest one. The government has granted the U.S. Postal Service the exclusive right to deliver mail.arrow_forward
- Q5Q6: Both questions correlate with each other. Complete the following using the grapharrow_forwardUBC coaching center has two branches in Dhaka: one in Dhanmondi (Branch A) and another one in Mohammadpur (Branch B). To understand their students' performance, the coaching center conducts the same test in both branches. A sample of 8 students have been selected from branches A and B respectively, and the following table shows data on their performance. Use appropriate non-parametric methods on the data to find out whether there is a statistically significant correlation between the ranks of the students’ performance of the two branches.?arrow_forwardHead and spine injury, along with the long-term effects of concussion of football players, is a very controversial health issue. As a result, the news has been covering this health issue, with many headlines involving famous NFL players. It has been assumed that this has made most Americans that follow football more aware of the risks involved in playing the game. However, we have not seen a decline in the number of young boys, ages 8-10, that are joining football leagues. For this age group to take part in playing football, these young boys need to have the permission of a parent or guardian to play, which demonstrates the adults support to their participation. Given the risks to these young boy’s health, we wonder why would parents allow or even encourage their children to play football? Using what you know about qualitative research, briefly explain (one page): How would you design a qualitative research study, with the goal of gaining an understanding of why parents allow their…arrow_forward
- Researchers conducted an observational study of automobile drivers and their cell phone use by manually observing traffic in heavily congested areas. They would record the amount of time they observed individual drivers on the phone while operating their vehicle in stop and go traffic and the number of accidents on a particular section of highway over the course of a month. The accompanying graph depict the data they recorded, each point represents a 1 mile section of heavily congested roads. From the data, which of these is a potentially valid conclusion? Cell-phone use while driving increases the rate of accidents. O Car accidents and cell-phone use have no relationship. The increasing rate of car accidents causes increased phone-call length. A conclusion cannot be made; the data ignores the omitted variable of which cell-phone provider each person uses. If the x and y variables were swapped, what would the new slope be? zero positive Number of car accidents 10- 9- 8- 7- 5- 4- 3- 2-…arrow_forwardA merchant who sells newspapers and magazines at the corner kiosk heard you manage the Times’ inventory and asks for your advice. She has a small, variable number of customers who daily purchase the Chicago Sun Times. In order to get the newspapers in time, she has to place an order for the next day’s newspapers before noon. She pays $0.50 for each newspaper and sells them for $1.50 each. She has kept detailed records of her past sales of the Chicago Sun Times and estimates that 10% of the time she sells 10 newspapers, 40% of the time she sells 11, 30% of the time she sells 12, and 20% of the time she sells 13. (a) What is the merchant’s marginal profit and marginal loss? (b) Determine how many Chicago Sun Times newspapers she should buy every day to maximize expected profits. (c) Calculate the merchant’s expected profits for the optimal order quantity. (d) The merchant has always purchased 13 newspapers, thinking that the best way to maximize profits was to always meet the demand.…arrow_forwardA traditional performance rating benchmark (or guideline) for “normal” effort, or speed, is dealing 52 cardsinto four piles, forming a square with each pile one footapart, in 0.50 minute. Conduct an experiment with one ormore fellow students in which one deals the cards andthe others rate the dealer’s performance, and then compare these subjective ratings with the actual time of thedealer.arrow_forward
arrow_back_ios
SEE MORE QUESTIONS
arrow_forward_ios
Recommended textbooks for you

 Principles of Economics (12th Edition)EconomicsISBN:9780134078779Author:Karl E. Case, Ray C. Fair, Sharon E. OsterPublisher:PEARSON
 Engineering Economy (17th Edition)EconomicsISBN:9780134870069Author:William G. Sullivan, Elin M. Wicks, C. Patrick KoellingPublisher:PEARSON
 Principles of Economics (MindTap Course List)EconomicsISBN:9781305585126Author:N. Gregory MankiwPublisher:Cengage Learning
 Managerial Economics: A Problem Solving ApproachEconomicsISBN:9781337106665Author:Luke M. Froeb, Brian T. McCann, Michael R. Ward, Mike ShorPublisher:Cengage Learning
 Managerial Economics & Business Strategy (Mcgraw-...EconomicsISBN:9781259290619Author:Michael Baye, Jeff PrincePublisher:McGraw-Hill Education
Principles of Economics (12th Edition)
Economics
ISBN:9780134078779
Author:Karl E. Case, Ray C. Fair, Sharon E. Oster
Publisher:PEARSON
Engineering Economy (17th Edition)
Economics
ISBN:9780134870069
Author:William G. Sullivan, Elin M. Wicks, C. Patrick Koelling
Publisher:PEARSON
Principles of Economics (MindTap Course List)
Economics
ISBN:9781305585126
Author:N. Gregory Mankiw
Publisher:Cengage Learning
Managerial Economics: A Problem Solving Approach
Economics
ISBN:9781337106665
Author:Luke M. Froeb, Brian T. McCann, Michael R. Ward, Mike Shor
Publisher:Cengage Learning
Managerial Economics & Business Strategy (Mcgraw-...
Economics
ISBN:9781259290619
Author:Michael Baye, Jeff Prince
Publisher:McGraw-Hill Education