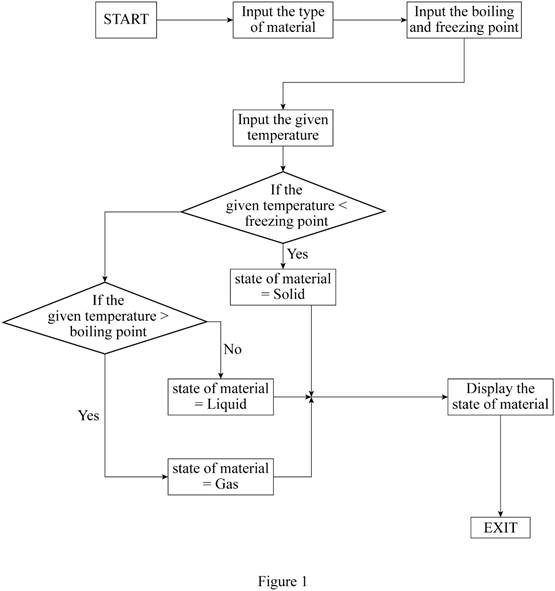
Create a written algorithm and flowchart to determine if a material is in the solid, liquid, or gaseous state given the temperature. The algorithm should acquire the name of the material, its freezing and boiling temperatures, and the actual temperature of the material from the user.
Write an algorithm that determines the state of a material at a given temperature for user specified material, freezing point and boiling point.
Explanation of Solution
Known:
- If the temperature is below freezing point, the material is in solid state.
- If the temperature is above the boiling point, the material is in gaseous state.
Unknown:
- The type of the material.
- The freezing point of the material.
- The boiling point of the material.
Assumptions:
- Assume that the interpreter of the algorithm will input the type of material, freezing point of the material, boiling point of the material and the temperature of the material.
Algorithm:
- Input the type of material, the numerical value of freezing point of the material, boiling point of the material and the temperature of the material.
- Ask if the temperature of the material is less than the freezing point.
-
- a. If yes, state of the material is Solid.
- b. If no, ask if the temperature of the material is greater than the boiling point.
- 1. If yes, the state of the material is Gas.
- 2. If no, the state of the material is Liquid.
- Display the type of the material and the state of the material at the given temperature.
- End the process.
Rules for creating a proper linear flowchart are as follows.
- The flowchart contains START rectangle to mention the beginning of a process.
- All the actions must be mentioned within rectangles.
- Connection between the blocks must be mentioned with a one-directional arrow.
- The flowchart contains END rectangle to mention the end of a process.
Flowchart to determine the state of a material is given in Figure 1.

Conclusion:
Hence, the algorithm and the flowchart that determines the state of a material at a given temperature are created.
Want to see more full solutions like this?
Chapter 18 Solutions
Thinking Like An Engineer: An Active Learning Approach, Student Value Edition (4th Edition)
- Sketch and describe hatch coamings. Describe structrual requirements to deck plating to compensate discontinuity for corners of a hatch. Show what is done to the deck plating when the decks are cut away and include the supporting members.arrow_forwardAn Inclining experiment done on a ship thats 6500 t, a mass of 30t was moved 6.0 m transvesly causing a 30 cm deflection in a 6m pendulum, calculate the transverse meta centre height.arrow_forwarda ship 150 m long and 20.5 m beam floats at a draught of8 m and displaces 19 500 tonne. The TPC is 26.5 and midshipsection area coefficient 0.94. Calculate the block, prismatic andwaterplane area coefficients.arrow_forward
- A vessel loads 680 t fuel between forward and aft deep tanks. centre of gravity of forward tank is 24m forward of ships COG. centre to centre between tanks is 42 m. how much in each tank to keep trim the samearrow_forwardBeam of a vessel is 11% its length. Cw =0.72. When floating in SW of relative denisity 1.03, TPC is 0.35t greater than in freshwater. Find the length of the shiparrow_forwardAn inclining experiment was carried out on a ship of 4000tonne displacement, when masses of 6 tonne were moved transverselythrough 13.5 m. The deflections of a 7.5 m pendulurnwere 81, 78, 85, 83, 79, 82, 84 and 80 mm respectively.Caiculate the metacentric height.arrow_forward
- A ship of 10 000 tonne displacement has a waterplanearea of 1300 m2. The ship loads in water of 1.010 t/m3 andmoves into water of 1.026 t/m3. Find the change in meandraughtarrow_forwardA ship of 7000 tonne displacement has a waterplane areaof 1500 m2. In passing from sea water into river water of1005 kg/m3 there is an increase in draught of 10 cm. Find the Idensity of the sea water.arrow_forwardA ship has 300 tonne of cargo in the hold, 24 m forward ofmidships. The displacement of the vessel is 6000 tonne and its centre of gravity is 1.2 m forward of midships.Find the new position of the centre of gravity if this cargo ismoved to an after hold, 40 m from midshipsarrow_forward
- Sketch and describe how ships are supported in dry dock. When and where does the greatest amount of stresses occur?arrow_forwardSketch and desribe a balanced rudder and how it is suspendedarrow_forwardA ship 140 m long and 18 m beam floats at a draught of9 m. The immersed cross-sectionai areas at equai intervais are 5,60, 116, 145, 152, 153, 153, 151, 142, 85 and 0 m2 respectively.Calculate:(a) displacement(b) block coefficient(c) midship section area coefficient(d) prismatic coefficient.arrow_forward
 Principles of Heat Transfer (Activate Learning wi...Mechanical EngineeringISBN:9781305387102Author:Kreith, Frank; Manglik, Raj M.Publisher:Cengage Learning
