
a)
The graph representing the LRAS curve.
a)
Explanation of Solution
The long-run
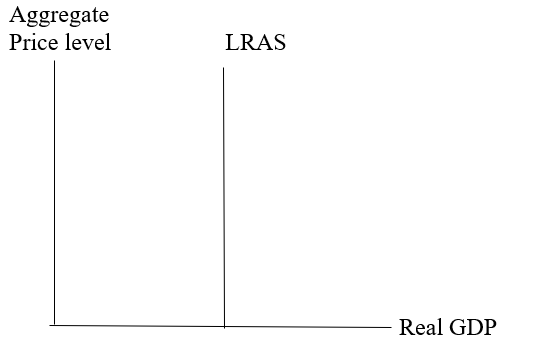
The graph shows the aggregate price level on the vertical axis and real
Introduction: An
b)
The graph labeling potential output.
b)
Explanation of Solution
The potential output on the graph of the long-run aggregate supply curve would represent as follows:
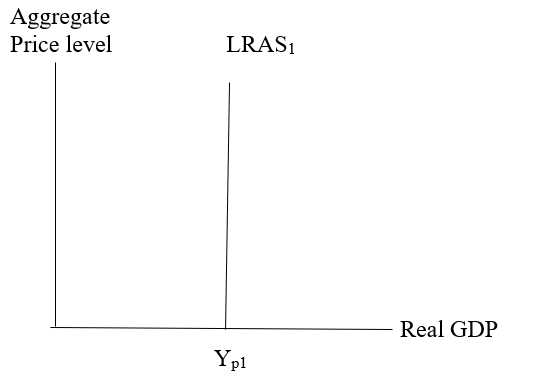
The graph shows the aggregate price level on the vertical axis and real GDP on the horizontal axis. Potential output is an output level where the economy enjoys full employment, therefore, the potential output is at the point of Yp1 where the long-run aggregate supply curve (LRAS1) intercepts a horizontal axis.
Introduction: An aggregate supply refers to the total supply of goods and services at different price levels (aggregated) in the economy. In simple words, it is the total quantity that is produced and sold by firms at different prices in the market.
c)
The graph representing an increase in the LRAS curve.
c)
Explanation of Solution
After an increase in the LRAS curve, the graph of the long-run aggregate supply curve would represent as follows:
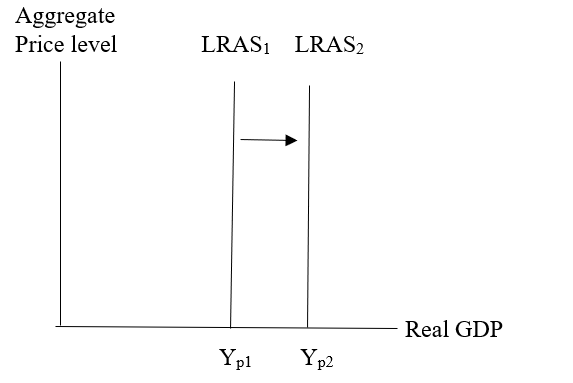
The graph shows the aggregate price level on the vertical axis and real GDP on the horizontal axis. When there is an increase in long-run supply, then the LRAS1 curve would shift to the right which is labeled as LRAS2 and it represents a vertical line where the output is labeled as Yp2. Due to an increase in factors of production such as labor, land, capital, etc. the long-run aggregate supply would also increase.
Introduction: An aggregate supply refers to the total supply of goods and services at different price levels (aggregated) in the economy. In simple words, it is the total quantity that is produced and sold by firms at different prices in the market.
d)
Possible three causes that change the long-run aggregate supply curve.
d)
Explanation of Solution
The causes of an increase in LRAS involve the increase in factors of production or a rise in the number of resources such as labor, land, capital, entrepreneurship, etc. which shifts the LRAS curve to the right because due to increase in these factors, the aggregate supply in long-run would also increase.
Moreover, an increase in the quality of resources is also the reason for the increase in LRAS which shifts the curve rightward. And, technological advancement or technological progress would be another reason for this increase as it can fasten the speed of production and provide more efficiency in manufacturing which, in turn, increase the aggregate supply in long run.
Introduction: An aggregate supply refers to the total supply of goods and services at different price levels (aggregated) in the economy. In simple words, it is the total quantity that is produced and sold by firms at different prices in the market.
Chapter 18 Solutions
Krugman's Economics For The Ap® Course


 Principles of Economics (12th Edition)EconomicsISBN:9780134078779Author:Karl E. Case, Ray C. Fair, Sharon E. OsterPublisher:PEARSON
 Engineering Economy (17th Edition)EconomicsISBN:9780134870069Author:William G. Sullivan, Elin M. Wicks, C. Patrick KoellingPublisher:PEARSON
 Principles of Economics (MindTap Course List)EconomicsISBN:9781305585126Author:N. Gregory MankiwPublisher:Cengage Learning
 Managerial Economics: A Problem Solving ApproachEconomicsISBN:9781337106665Author:Luke M. Froeb, Brian T. McCann, Michael R. Ward, Mike ShorPublisher:Cengage Learning
 Managerial Economics & Business Strategy (Mcgraw-...EconomicsISBN:9781259290619Author:Michael Baye, Jeff PrincePublisher:McGraw-Hill Education