Campbell Essential Biology (7th Edition)
7th Edition
ISBN: 9780134765037
Author: Eric J. Simon, Jean L. Dickey, Jane B. Reece
Publisher: PEARSON
expand_more
expand_more
format_list_bulleted
Concept explainers
Videos
Textbook Question
Chapter 18, Problem 17PS
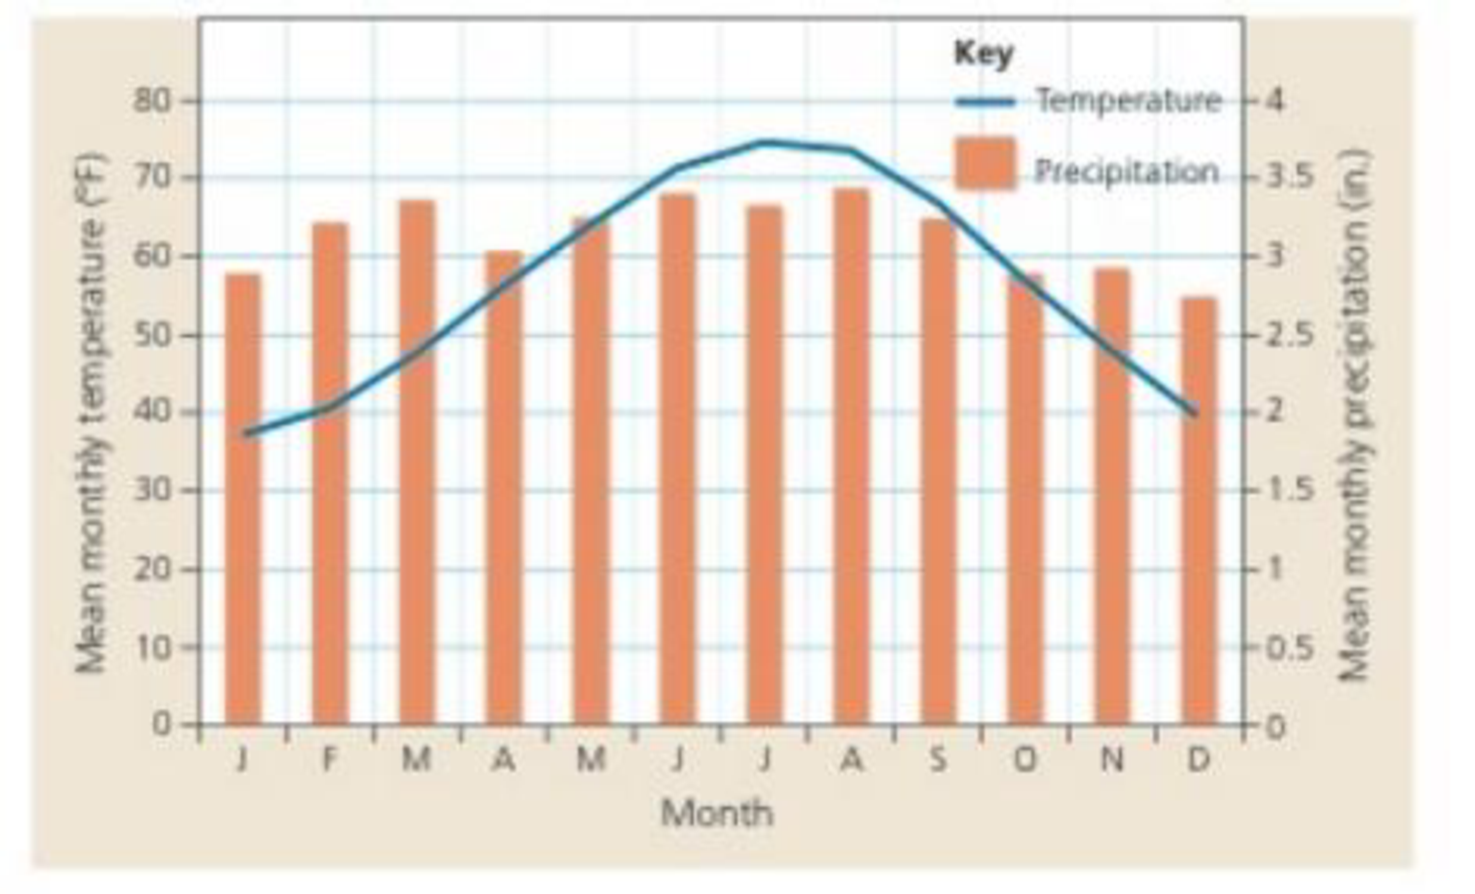
Interpreting Data This graph shows average monthly temperature and average precipitation for a city in the Northern Hemisphere. Based on the biome descriptions on page 385–390, in which biome is this city located? Explain your answer.
Expert Solution & Answer
Want to see the full answer?
Check out a sample textbook solution
Students have asked these similar questions
Which of the following is the process that is "capable of destroying all forms of microbial life"?
Question 37 options:
Surgical scrub
Sterilization
Chemical removal
Mechanical removal
After you feel comfortable with your counting method and identifying cells in the various stages of mitosis, use the four images below of whitefish blastula to count the cells in each stage until you reach 100 total cells, recording your data below in Data Table 1. (You may not need to use all four images. Stop counting when you reach 100 total cells.)
After totaling the cells in each stage, calculate the percent of cells in each stage. (Divide total of stage by overall total of 100 and then multiply by 100 to obtain percentage.)
Data Table 1Stage Totals PercentInterphase Mitosis: Prophase Metaphase Anaphase Telophase Cytokinesis Totals 100 100%
To find the length of time whitefish blastula cells spend in each stage, multiply the percent (recorded as a decimal, in other words take the percent number and divide by 100) by 24 hours. (Example: If percent is 20%, then Time in Hours = .2 * 24 = 4.8) Record your data in Data…
What are Clathrin coated vesicles and what is their function?
Chapter 18 Solutions
Campbell Essential Biology (7th Edition)
Ch. 18 - Place these levels of ecological study in order...Ch. 18 - Name several abiotic factors that might affect the...Ch. 18 - Prob. 3SQCh. 18 - Which of the following sea creatures might be...Ch. 18 - Prob. 5SQCh. 18 - Prob. 6SQCh. 18 - Prob. 7SQCh. 18 - What human activity is responsible for the...Ch. 18 - Prob. 9SQCh. 18 - The recent increase in atmospheric CO2...
Ch. 18 - What populations of organisms are most likely to...Ch. 18 - Prob. 12IMTCh. 18 - Prob. 13IMTCh. 18 - For each statement, identify which major theme is...Ch. 18 - Prob. 15IMTCh. 18 - Design a laboratory experiment to measure the...Ch. 18 - Interpreting Data This graph shows average monthly...Ch. 18 - Some people are not convinced that human-induced...Ch. 18 - Research your countrys per capita (per person)...
Knowledge Booster


Learn more about
Need a deep-dive on the concept behind this application? Look no further. Learn more about this topic, biology and related others by exploring similar questions and additional content below.Similar questions
- How is a protein destined for the Endoplasmic Reticulum (ER), imported into the ER? Be concise.arrow_forwardFind out about the organisations and the movements aimed at the conservation of our natural resources. Eg Chipko movement and Greenpeace. Make a project report on such an organisation.arrow_forwardWhat are biofertilizers and mention the significancearrow_forward
- PCBs and River Otters: Otters in Washington State’s Green-Duwamish River have high levels of polychlorinated biphenyls (PCBs) in their livers. PCBs can bind to the estrogen receptors in animals and disrupt the endocrine system of these otters. The PCBs seem to increase the estrogen to androgen ratio, skewing the ratio toward too much estrogen. How would increased estrogen affect the river otter population? Based on your reading of the materials in this unit, what factors can affect fertility in humans? Explain how each of the factors affecting human fertility that you described can disrupt the human endocrine system to affect reproduction.arrow_forwardOther than oil and alcohol, are there other liquids you could compare to water (that are liquid at room temperature)? How is water unique compared to these other liquids? What follow-up experiment would you like to do, and how would you relate it to your life?arrow_forwardSelection of Traits What adaptations do scavengers have for locating and feeding on prey? What adaptations do predators have for capturing and consuming prey?arrow_forward
- Competition Between Species What natural processes limit populations from growing too large? What are some resources organisms can compete over in their natural habitat?arrow_forwardSpecies Interactions Explain how predators, prey and scavengers interact. Explain whether predators and scavengers are necessary or beneficial for an ecosystem.arrow_forwardmagine that you are conducting research on fruit type and seed dispersal. You submitted a paper to a peer-reviewed journal that addresses the factors that impact fruit type and seed dispersal mechanisms in plants of Central America. The editor of the journal communicates that your paper may be published if you make ‘minor revisions’ to the document. Describe two characteristics that you would expect in seeds that are dispersed by the wind. Contrast this with what you would expect for seeds that are gathered, buried or eaten by animals, and explain why they are different. (Editor’s note: Providing this information in your discussion will help readers to consider the significance of the research).arrow_forward
arrow_back_ios
SEE MORE QUESTIONS
arrow_forward_ios
Recommended textbooks for you
 Concepts of BiologyBiologyISBN:9781938168116Author:Samantha Fowler, Rebecca Roush, James WisePublisher:OpenStax College
 Biology 2eBiologyISBN:9781947172517Author:Matthew Douglas, Jung Choi, Mary Ann ClarkPublisher:OpenStax
 Human Biology (MindTap Course List)BiologyISBN:9781305112100Author:Cecie Starr, Beverly McMillanPublisher:Cengage Learning
 Biology (MindTap Course List)BiologyISBN:9781337392938Author:Eldra Solomon, Charles Martin, Diana W. Martin, Linda R. BergPublisher:Cengage Learning
 Biology Today and Tomorrow without Physiology (Mi...BiologyISBN:9781305117396Author:Cecie Starr, Christine Evers, Lisa StarrPublisher:Cengage Learning
 Biology: The Unity and Diversity of Life (MindTap...BiologyISBN:9781305073951Author:Cecie Starr, Ralph Taggart, Christine Evers, Lisa StarrPublisher:Cengage Learning
Concepts of Biology
Biology
ISBN:9781938168116
Author:Samantha Fowler, Rebecca Roush, James Wise
Publisher:OpenStax College
Biology 2e
Biology
ISBN:9781947172517
Author:Matthew Douglas, Jung Choi, Mary Ann Clark
Publisher:OpenStax
Human Biology (MindTap Course List)
Biology
ISBN:9781305112100
Author:Cecie Starr, Beverly McMillan
Publisher:Cengage Learning
Biology (MindTap Course List)
Biology
ISBN:9781337392938
Author:Eldra Solomon, Charles Martin, Diana W. Martin, Linda R. Berg
Publisher:Cengage Learning
Biology Today and Tomorrow without Physiology (Mi...
Biology
ISBN:9781305117396
Author:Cecie Starr, Christine Evers, Lisa Starr
Publisher:Cengage Learning
Biology: The Unity and Diversity of Life (MindTap...
Biology
ISBN:9781305073951
Author:Cecie Starr, Ralph Taggart, Christine Evers, Lisa Starr
Publisher:Cengage Learning
DIVERSITY IN PLANTS; Author: 7activestudio;https://www.youtube.com/watch?v=uJrks56FQIY;License: Standard YouTube License, CC-BY
Biology- Plant Kingdom - Diversity in Living Organisms - Part 4 - English - English; Author: Bodhaguru;https://www.youtube.com/watch?v=QFgQ74EvfDQ;License: Standard YouTube License, CC-BY