
Modern Business Statistics with Microsoft Office Excel (with XLSTAT Education Edition Printed Access Card) (MindTap Course List)
6th Edition
ISBN: 9781337115186
Author: David R. Anderson, Dennis J. Sweeney, Thomas A. Williams, Jeffrey D. Camm, James J. Cochran
Publisher: Cengage Learning
expand_more
expand_more
format_list_bulleted
Concept explainers
Videos
Textbook Question
Chapter 17.4, Problem 24E
The following data shows the average interest rate (%) for a 30-year fixed-rate mortgage over a ten-year period (FreddieMac website, July 30, 2016).
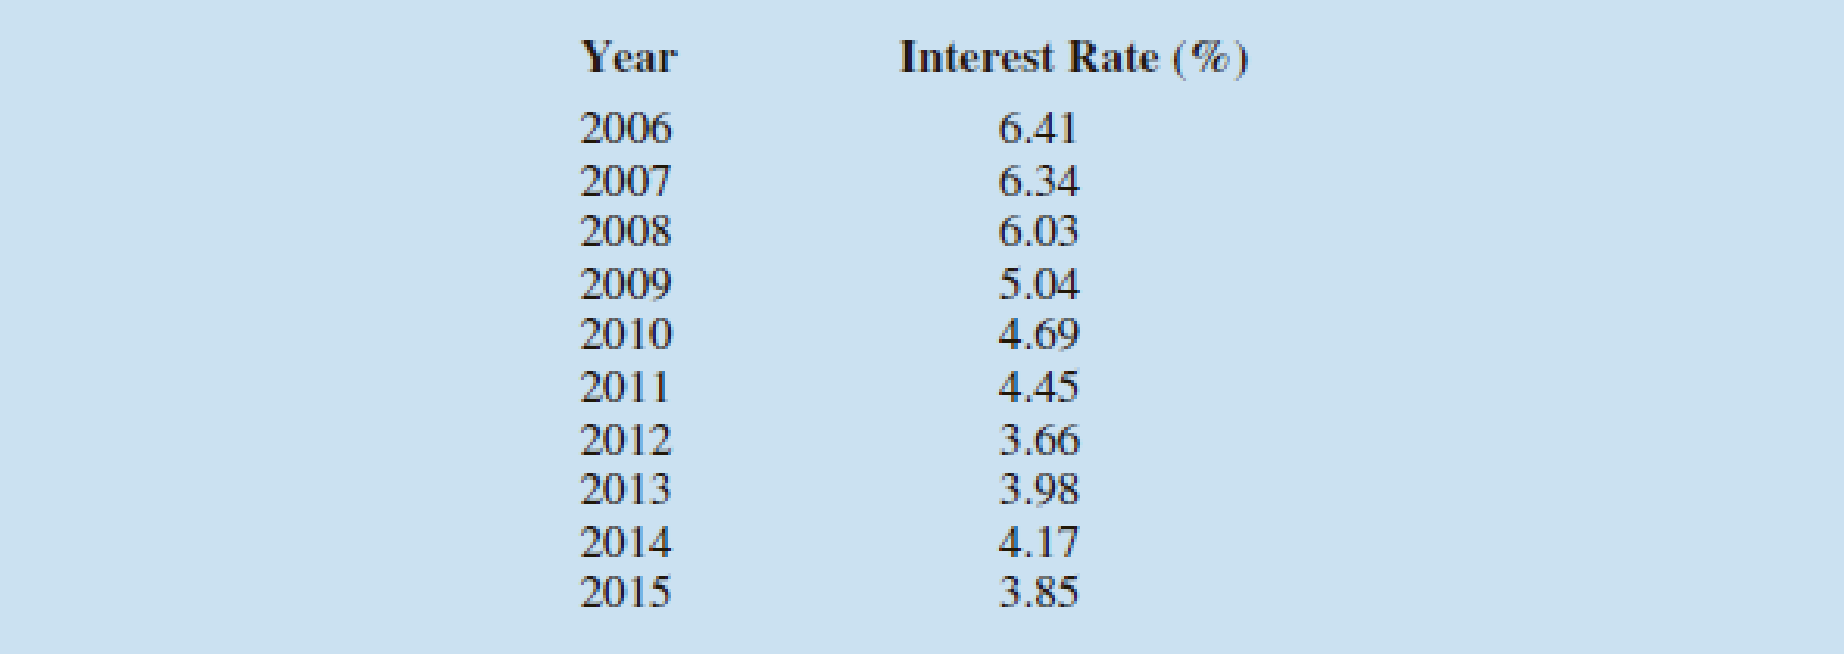
- a. Construct a time series plot. Do you think a linear trend or a quadratic trend will provide a better fit for this time series? Why?
- b. Develop the linear trend equation for this time series. Using this linear trend equation, forecast the average interest rate for 2016.
- c. Develop the
quadratic trend equation for this time series. Using this quadratic trend equation, forecast the average interest rate for 2016. - d. Compare your answers to parts (b) and (c). Which model would you recommend? Why?
Expert Solution & Answer
Want to see the full answer?
Check out a sample textbook solution
Students have asked these similar questions
Could you please answer this question using excel. For 1a) I got 84.75 and for part 1b) I got 85.33 and was wondering if you could check if my answers were correct. Thanks
What is one sample T-test? Give an example of business application of this test?
What is Two-Sample T-Test. Give an example of business application of this test?
.What is paired T-test. Give an example of business application of this test?
What is one way ANOVA test. Give an example of business application of this test?
1. One Sample T-Test: Determine whether the average satisfaction rating of customers for a product is significantly different from a hypothetical mean of 75.
(Hints: The null can be about maintaining status-quo or no difference; If your alternative hypothesis is non-directional (e.g., μ≠75), you should use the two-tailed p-value from excel file to make a decision about rejecting or not rejecting null. If alternative is directional (e.g., μ < 75), you should use the lower-tailed p-value. For alternative hypothesis μ > 75, you should use the upper-tailed p-value.)
H0 =
H1=
Conclusion: The p value from one sample t-test is _______. Since the two-tailed p-value…
Using the accompanying Accounting Professionals data to answer the following questions.
a. Find and interpret a 90% confidence interval for the mean years of service.
b. Find and interpret a 90% confidence interval for the proportion of employees who have a graduate degree.
view the Accounting Professionals data.
Employee Years of Service Graduate Degree?1 26 Y2 8 N3 10 N4 6 N5 23 N6 5 N7 8 Y8 5 N9 26 N10 14 Y11 10 N12 8 Y13 7 Y14 27 N15 16 Y16 17 N17 21 N18 9 Y19 9 N20 9 N
Question content area bottom
Part 1
a. A 90% confidence interval for the mean years of service is
(Use ascending order. Round to two decimal places as needed.)
Chapter 17 Solutions
Modern Business Statistics with Microsoft Office Excel (with XLSTAT Education Edition Printed Access Card) (MindTap Course List)
Ch. 17.2 - 1. Consider the following time series...Ch. 17.2 - 2. Refer to the time series data in exercise 1....Ch. 17.2 - Prob. 3ECh. 17.2 - 4. Consider the following time series...Ch. 17.3 - Consider the following time series...Ch. 17.3 - Consider the following time series...Ch. 17.3 - Refer to the gasoline sales time series data in...Ch. 17.3 - Prob. 8ECh. 17.3 - 9. With the gasoline time series data from Table...Ch. 17.3 - 10. With a smoothing constant of α = .2, equation...
Ch. 17.3 - For the Hawkins Company, the monthly percentages...Ch. 17.3 - Corporate triple-A bond interest rates for 12...Ch. 17.3 - The values of Alabama building contracts (in $...Ch. 17.3 - The following time series shows the sales of a...Ch. 17.3 - Ten weeks of data on the Commodity Futures Index...Ch. 17.3 - Prob. 16ECh. 17.4 - Consider the following time series...Ch. 17.4 - Prob. 18ECh. 17.4 - Prob. 19ECh. 17.4 - Prob. 20ECh. 17.4 - Prob. 21ECh. 17.4 - Prob. 22ECh. 17.4 - The president of a small manufacturing firm is...Ch. 17.4 - The following data shows the average interest rate...Ch. 17.4 - Quarterly revenue ($ millions) for Twitter for the...Ch. 17.4 - Giovanni Food Products produces and sells frozen...Ch. 17.4 - The number of users of Facebook from 2004 through...Ch. 17.5 - Consider the following time series.
Construct a...Ch. 17.5 - Consider the following time series...Ch. 17.5 - The quarterly sales data (number of copies sold)...Ch. 17.5 - Air pollution control specialists in southern...Ch. 17.5 - South Shore Construction builds permanent docks...Ch. 17.5 - Prob. 33ECh. 17.5 - Prob. 34ECh. 17.6 - Consider the following time series...Ch. 17.6 - Refer to exercise 35.
Deseasonalize the time...Ch. 17.6 - The quarterly sales data (number of copies sold)...Ch. 17.6 - Three years of monthly lawn-maintenance expenses...Ch. 17.6 - Air pollution control specialists in southern...Ch. 17.6 - Electric power consumption is measured in...Ch. 17 - The weekly demand (in cases) for a particular...Ch. 17 - The following table reports the percentage of...Ch. 17 - United Dairies, Inc., supplies milk to several...Ch. 17 - Annual retail store revenue for Apple from 2007 to...Ch. 17 - The Mayfair Department Store in Davenport, Iowa,...Ch. 17 - Prob. 47SECh. 17 - The Costello Music Company has been in business...Ch. 17 - Consider the Costello Music Company problem in...Ch. 17 - Prob. 50SECh. 17 - Refer to the Costello Music Company time series in...Ch. 17 - Prob. 52SECh. 17 - Refer to the Hudson Marine problem in exercise 52....Ch. 17 - Refer to the Hudson Marine problem in exercise...Ch. 17 - Refer to the Hudson Marine data in exercise...Ch. 17 - Forecasting Food and Beverage Sales
The Vintage...Ch. 17 - The Carlson Department Store suffered heavy damage...
Knowledge Booster


Learn more about
Need a deep-dive on the concept behind this application? Look no further. Learn more about this topic, statistics and related others by exploring similar questions and additional content below.Similar questions
- If, based on a sample size of 900,a political candidate finds that 509people would vote for him in a two-person race, what is the 95%confidence interval for his expected proportion of the vote? Would he be confident of winning based on this poll? Question content area bottom Part 1 A 9595% confidence interval for his expected proportion of the vote is (Use ascending order. Round to four decimal places as needed.)arrow_forwardQuestions An insurance company's cumulative incurred claims for the last 5 accident years are given in the following table: Development Year Accident Year 0 2018 1 2 3 4 245 267 274 289 292 2019 255 276 288 294 2020 265 283 292 2021 263 278 2022 271 It can be assumed that claims are fully run off after 4 years. The premiums received for each year are: Accident Year Premium 2018 306 2019 312 2020 318 2021 326 2022 330 You do not need to make any allowance for inflation. 1. (a) Calculate the reserve at the end of 2022 using the basic chain ladder method. (b) Calculate the reserve at the end of 2022 using the Bornhuetter-Ferguson method. 2. Comment on the differences in the reserves produced by the methods in Part 1.arrow_forwardA population that is uniformly distributed between a=0and b=10 is given in sample sizes 50( ), 100( ), 250( ), and 500( ). Find the sample mean and the sample standard deviations for the given data. Compare your results to the average of means for a sample of size 10, and use the empirical rules to analyze the sampling error. For each sample, also find the standard error of the mean using formula given below. Standard Error of the Mean =sigma/Root Complete the following table with the results from the sampling experiment. (Round to four decimal places as needed.) Sample Size Average of 8 Sample Means Standard Deviation of 8 Sample Means Standard Error 50 100 250 500arrow_forward
- A survey of 250250 young professionals found that two dash thirdstwo-thirds of them use their cell phones primarily for e-mail. Can you conclude statistically that the population proportion who use cell phones primarily for e-mail is less than 0.720.72? Use a 95% confidence interval. Question content area bottom Part 1 The 95% confidence interval is left bracket nothing comma nothing right bracket0.60820.6082, 0.72510.7251. As 0.720.72 is within the limits of the confidence interval, we cannot conclude that the population proportion is less than 0.720.72. (Use ascending order. Round to four decimal places as needed.)arrow_forwardI need help with this problem and an explanation of the solution for the image described below. (Statistics: Engineering Probabilities)arrow_forwardA survey of 250 young professionals found that two-thirds of them use their cell phones primarily for e-mail. Can you conclude statistically that the population proportion who use cell phones primarily for e-mail is less than 0.72? Use a 95% confidence interval. Question content area bottom Part 1 The 95% confidence interval is [ ], [ ] As 0.72 is ▼ above the upper limit within the limits below the lower limit of the confidence interval, we ▼ can cannot conclude that the population proportion is less than 0.72. (Use ascending order. Round to four decimal places as needed.)arrow_forward
- I need help with this problem and an explanation of the solution for the image described below. (Statistics: Engineering Probabilities)arrow_forwardI need help with this problem and an explanation of the solution for the image described below. (Statistics: Engineering Probabilities)arrow_forwardI need help with this problem and an explanation of the solution for the image described below. (Statistics: Engineering Probabilities)arrow_forward
- Questions An insurance company's cumulative incurred claims for the last 5 accident years are given in the following table: Development Year Accident Year 0 2018 1 2 3 4 245 267 274 289 292 2019 255 276 288 294 2020 265 283 292 2021 263 278 2022 271 It can be assumed that claims are fully run off after 4 years. The premiums received for each year are: Accident Year Premium 2018 306 2019 312 2020 318 2021 326 2022 330 You do not need to make any allowance for inflation. 1. (a) Calculate the reserve at the end of 2022 using the basic chain ladder method. (b) Calculate the reserve at the end of 2022 using the Bornhuetter-Ferguson method. 2. Comment on the differences in the reserves produced by the methods in Part 1.arrow_forwardQuestions An insurance company's cumulative incurred claims for the last 5 accident years are given in the following table: Development Year Accident Year 0 2018 1 2 3 4 245 267 274 289 292 2019 255 276 288 294 2020 265 283 292 2021 263 278 2022 271 It can be assumed that claims are fully run off after 4 years. The premiums received for each year are: Accident Year Premium 2018 306 2019 312 2020 318 2021 326 2022 330 You do not need to make any allowance for inflation. 1. (a) Calculate the reserve at the end of 2022 using the basic chain ladder method. (b) Calculate the reserve at the end of 2022 using the Bornhuetter-Ferguson method. 2. Comment on the differences in the reserves produced by the methods in Part 1.arrow_forwardFrom a sample of 26 graduate students, the mean number of months of work experience prior to entering an MBA program was 34.67. The national standard deviation is known to be18 months. What is a 90% confidence interval for the population mean? Question content area bottom Part 1 A 9090% confidence interval for the population mean is left bracket nothing comma nothing right bracketenter your response here,enter your response here. (Use ascending order. Round to two decimal places as needed.)arrow_forward
arrow_back_ios
SEE MORE QUESTIONS
arrow_forward_ios
Recommended textbooks for you
 MATLAB: An Introduction with ApplicationsStatisticsISBN:9781119256830Author:Amos GilatPublisher:John Wiley & Sons Inc
 Probability and Statistics for Engineering and th...StatisticsISBN:9781305251809Author:Jay L. DevorePublisher:Cengage Learning
 Statistics for The Behavioral Sciences (MindTap C...StatisticsISBN:9781305504912Author:Frederick J Gravetter, Larry B. WallnauPublisher:Cengage Learning
 Elementary Statistics: Picturing the World (7th E...StatisticsISBN:9780134683416Author:Ron Larson, Betsy FarberPublisher:PEARSON
 The Basic Practice of StatisticsStatisticsISBN:9781319042578Author:David S. Moore, William I. Notz, Michael A. FlignerPublisher:W. H. Freeman
 Introduction to the Practice of StatisticsStatisticsISBN:9781319013387Author:David S. Moore, George P. McCabe, Bruce A. CraigPublisher:W. H. Freeman
MATLAB: An Introduction with Applications
Statistics
ISBN:9781119256830
Author:Amos Gilat
Publisher:John Wiley & Sons Inc
Probability and Statistics for Engineering and th...
Statistics
ISBN:9781305251809
Author:Jay L. Devore
Publisher:Cengage Learning
Statistics for The Behavioral Sciences (MindTap C...
Statistics
ISBN:9781305504912
Author:Frederick J Gravetter, Larry B. Wallnau
Publisher:Cengage Learning
Elementary Statistics: Picturing the World (7th E...
Statistics
ISBN:9780134683416
Author:Ron Larson, Betsy Farber
Publisher:PEARSON
The Basic Practice of Statistics
Statistics
ISBN:9781319042578
Author:David S. Moore, William I. Notz, Michael A. Fligner
Publisher:W. H. Freeman
Introduction to the Practice of Statistics
Statistics
ISBN:9781319013387
Author:David S. Moore, George P. McCabe, Bruce A. Craig
Publisher:W. H. Freeman
Use of ALGEBRA in REAL LIFE; Author: Fast and Easy Maths !;https://www.youtube.com/watch?v=9_PbWFpvkDc;License: Standard YouTube License, CC-BY
Compound Interest Formula Explained, Investment, Monthly & Continuously, Word Problems, Algebra; Author: The Organic Chemistry Tutor;https://www.youtube.com/watch?v=P182Abv3fOk;License: Standard YouTube License, CC-BY
Applications of Algebra (Digit, Age, Work, Clock, Mixture and Rate Problems); Author: EngineerProf PH;https://www.youtube.com/watch?v=Y8aJ_wYCS2g;License: Standard YouTube License, CC-BY