
a:
Derive the regression equation.
a:
Explanation of Solution
The ANOVA table output is obtained using the statistical software. The result is given below:
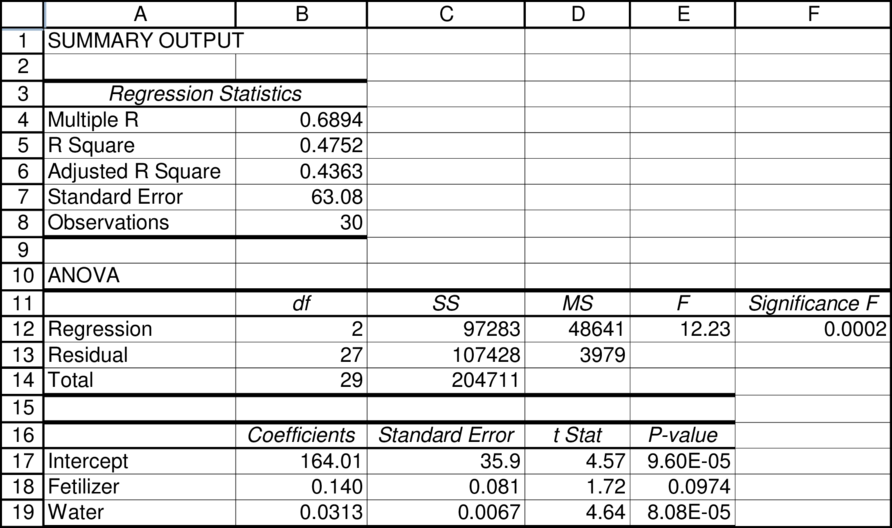
The general regression line can be derived as follows:Intercept is denoted by IC and the coefficient is denoted by CE
Substitute the respective value in Equation (1) to derive the regression equation.
b:
Testing the hypothesis.
b:
Explanation of Solution
The null hypothesis (H0)
The calculated t value is 1.72 and the p value is 0.0974. Since the p value is significantly different from 0, the alternate hypothesis is not accepted.
c:
Testing the new hypothesis.
c:
Explanation of Solution
The null hypothesis (H0)
The calculated t value is 4.64 and the p value is 0.0001. Since the p value is nearly equal to 0, the alternate hypothesis is accepted.
d:
Standard error.
d:
Explanation of Solution
The standard error is 63.08 and the R square value is 0.4572. This indicates the good fit of the model.
e
Normality requirement.
e
Explanation of Solution
The distribution of the variable is obtained using the statistical software. The result is given below:
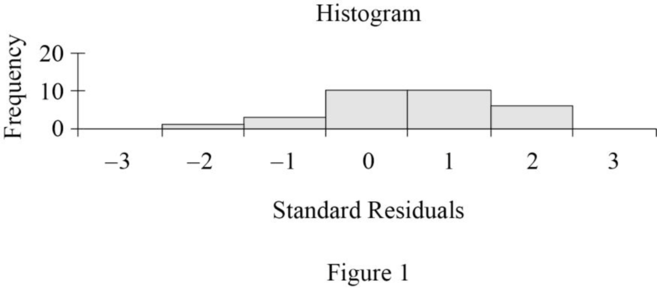
The required condition is that the variable should be distributed normally. Since the histogram is bell shaped, the error variable is distributed normally. Thus, the required condition is satisfied.
The variance of the error is obtained using the statistical software. The result is given below:
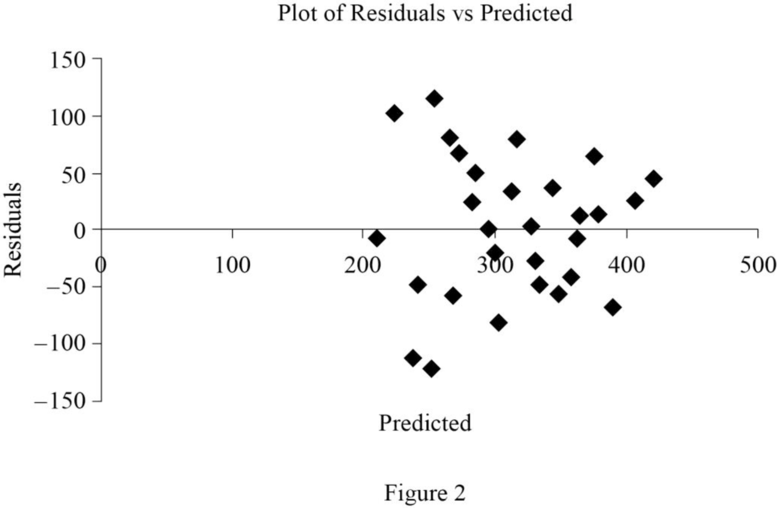
From Figure 2, it is known that the error variable is not constant.
f:
Calculate the upper limit and the lower limit.
f:
Explanation of Solution
The upper limit and the lower limit areobtained using the statistical software. The result is given below:
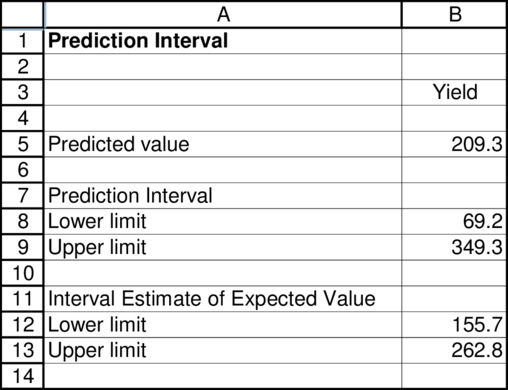
The lower limit is 69.2 and the upper limit is 349.3.
Want to see more full solutions like this?
Chapter 17 Solutions
Statistics for Management and Economics (Book Only)

- Why can we not use first differences when we have independent cross sections in two years (as opposed to panel data)?arrow_forwardAverage prices (in dollars) were recorded for three types of beverage across all 8 major Australian states and territories. In how many states/territories is the average price of a cappuccino higher than the average price of a flat white?arrow_forwardTextbook authors must be careful that the reading level of their book is appropriate for the target audience. Some methods of assessing reading level require estimating the average word length. We've randomly chosen 20 words from a randomly selected page in Intro Stats and counted the number of letters in each word: 5, 5, 2, 11, 3, 5, 6, 8, 5, 4, 7, 2, 9, 4, 8, 10, 4, 7, 6, 9 Suppose that our editor was hoping that the book would have a mean word length of 6.8 letters. Does this sample indicate that the authors failed to meet this goal? With a significance level of 0.05, test an appropriate hypothesis and state your conclusion. (i.e state the appropriate null and alternative hypotheses, calculate the test statistic, conclude and interpret it).arrow_forward
- A manufacturer of cat food was planning to survey households in the US to determine purchasing habits of cat owners. Among the questions to be included are those that relate to Where cat fat is primarily purchased. Whether dry or moist cat food is purchased. The number of cats living in the household. Whether the cat is pedigreed. Describe the population. For each of the four items listed, indicate whether the variable is categorical or numerical.arrow_forwardA life insurance company wishes to examine the relationship between the amount of life insurance held by a family and family income. From a random sample of households, the company collected the accompanying INCOME 97 INSUR 38 data. The data are in units of thousands of dollars. INSUR 141 29 Let y = 280 75 X = INCOME 303 81 453 137 357 77 199 43 251 53 807 184 147 45 272 70 537 128 527 117 245 55 483 116 673 204 194 46 154 51 163 48 280 69 507 140 464 136 321 71 873 206 476 144 574 111 251 65 497 130 826 171 133 32 259 82 281 73 446 146 3 The vertical intercept of the estimated regression equation is 332 77 a 11.009 219 48 b 9.830 208 55 8.776 180 48 d 7.836 169 42 273 69 502 127 547 126 281 80 428 143 370 77 221 49 214 51arrow_forwardA researcher investigated whether a father's level of optimism was predictive of his son's optimism as a young adult. Twenty (20) fathers and sons who agreed to participate in the study were administered a scale measuring their current level of optimism (the scale ranged from 10 to 50), with higher scores indicating greater optimism.arrow_forward
- Birth weight and smoking during pregnancy,Birthweight,Smoker3771,03140,03317,04210,03076,03771,03487,03487,01559,03630,03572,03260,03430,04224,02955,03912,03196,03459,03459,03430,02750,03686,03260,03969,03430,03629,02863,02830,03105,02948,03175,04309,03232,03487,02807,03820,03941,02211,03204,03657,13487,12495,14253,13147,13600,13005,12552,13147,14593,13430,11985,13317,13487,13884,13289,13470,12665,13090,12835,11843,14451,12863,1900,12353,13317,12850,13560,13080,12325,13119,13175,13313,13374,12750,12835,13345,12637,13742,13119,13345,13175,12013,13232,13286,13360,13402,12948,12580,13260,13686,12750,12977,12580,14082,12807,12381,13175,13714,13544,13544,1arrow_forwardMany parents allow underage children to drink alcohol in limited situations when an adult is present to supervise. The idea is that teens will learn responsible drinking habits if they first experience alcohol in a controlled environment. Other parents take a strict no-drinking approach. Researchers surveyed a sample of 200 students aged 14 to 17, about their alcohol use and about alcohol related problems. Using a=0.05, answer the questions No Alcohol related Problems Alcohol Related Problems Not allowed to drink 71 9 80 Allowed to drink 89 31 |120 160 40 N=200 What is the alternative hypothesis? [ Select] What is the null hypothesis? [ Select] What inferential test is being conducted? [ Select] What is the obtained statistic? [ Select ] What determines the critical value? [ Select ] What is the critical value? [ Select ] What is the decision rule? [ Select] What is your decision? [ Select] What is your conclusion? [ Select ]arrow_forwardA number of particular articles has been classified according to their weights. After drying for two weeks the same articles have again been weighted and similarly classified. It is known that the median weight in the first weighing was 20-83 gm. while in the second weighing it was 17-35 gm. Some frequencies a and b in the first weighing and x and y in the second are missing. It is known that a = x and b missing frequencies. 1 5 y. Find out the values of the Class Frequencies Class Frequencies 1st weighing 2nd weighing 1st weighing 2nd weighing 0-5 15-20 52 a 50 5-10 20-25 75 30 10-15 11 40 25-30 22 28arrow_forward
- Question: In two large populations, there are 30 and 25 per cent respectively of blue-eyed people. Is this difference likely to be hidden in samples of 1,200 and 900 respectively from the two populations ?arrow_forwardMedical tests were conducted to learn about drug-resistant tuberculosis. Of 142 cases tested in New Jersey, 9 were found to be drug-resistant. Of 268 cases tested in Texas, 5 were found to be drug-resistant. Do these data suggest a statistically significant difference between the proportions of drug-resistant cases in the two states? Use a .02 level of significance. What is the -value, and what is your conclusion? Test statistic =arrow_forwardX1=80 X2=180 A=400 B=200arrow_forward

 Principles of Economics (12th Edition)EconomicsISBN:9780134078779Author:Karl E. Case, Ray C. Fair, Sharon E. OsterPublisher:PEARSON
 Engineering Economy (17th Edition)EconomicsISBN:9780134870069Author:William G. Sullivan, Elin M. Wicks, C. Patrick KoellingPublisher:PEARSON
 Principles of Economics (MindTap Course List)EconomicsISBN:9781305585126Author:N. Gregory MankiwPublisher:Cengage Learning
 Managerial Economics: A Problem Solving ApproachEconomicsISBN:9781337106665Author:Luke M. Froeb, Brian T. McCann, Michael R. Ward, Mike ShorPublisher:Cengage Learning
 Managerial Economics & Business Strategy (Mcgraw-...EconomicsISBN:9781259290619Author:Michael Baye, Jeff PrincePublisher:McGraw-Hill Education