
Mindtapv2.0 For Anderson/sweeney/williams/camm/cochran's Modern Business Statistics With Microsoft Excel, 1 Term Printed Access Card (mindtap Course List)
6th Edition
ISBN: 9780357110638
Author: David R. Anderson, Dennis J. Sweeney, Thomas A. Williams, Jeffrey D. Camm, James J. Cochran
Publisher: Cengage Learning
expand_more
expand_more
format_list_bulleted
Videos
Textbook Question
Chapter 17, Problem 53SE
Refer to the Hudson Marine problem in exercise 52. Suppose the quarterly sales values for the seven years of historical data are as follows.
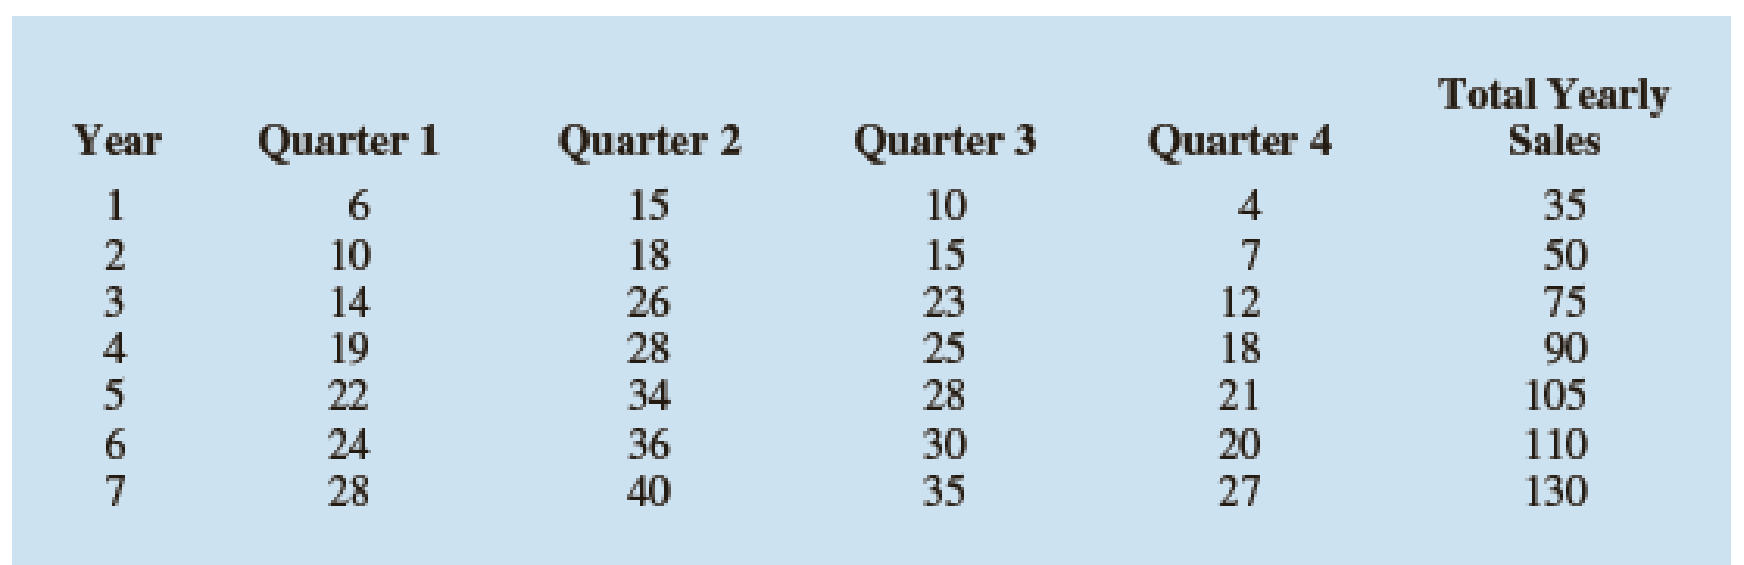
- a. Use the following dummy variables to develop an estimated regression equation to account for any season and linear trend effects in the data: Qtr1 = 1 if Quarter 1, 0 otherwise; Qtr2 = 1 if Quarter 2, 0 otherwise; and Qtr3 = 1 if Quarter 3, 0 otherwise.
- b. Compute the quarterly forecasts for next year.
52. Hudson Marine has been an authorized dealer for C&D marine radios for the past seven years. The following table reports the number of radios sold each year.
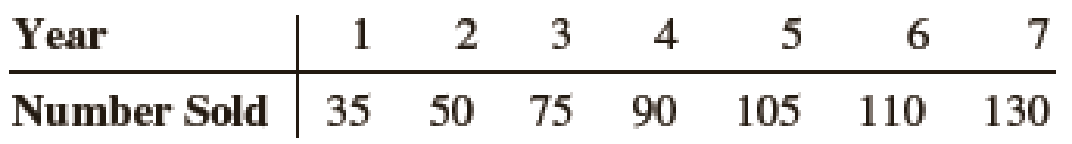
- a. Construct a time series plot. Does a linear trend appear to be present?
- b. Compute the linear trend equation for this time series.
- c. Use the linear trend equation developed in part (b) to develop a forecast for annual sales in year 8.
Expert Solution & Answer
Want to see the full answer?
Check out a sample textbook solution
Students have asked these similar questions
Consider the following data on salaries and experience. Persons 2,4,6,8,and 9 have MBA degrees. All others only have undergraduate degrees.
Calculate the regression of Salary on Experience within a model that controls for whether a person has an MBA or not.
Print the data set that allows you to do this regression. Sketch the graph the estimated regression that clearly indicates the impact of a MBA degree on Salary.
What is the market value of the MBA degree?
Person Salary Experience
1 $130,468 10 Years
2 62,250 1
3 50,000 2.3
4 140,000 9
5 110,000 8
6 80,050 2.8
7 95,772 7
8 110,000 6
9 87,752 4.2
10 79,290 5
Consider the following data on salaries and experience. Persons 2,4,6,8,and 9 have MBA degrees. All others only have undergraduate degrees.
a. Calculate the regression of Salary on Experience within a model that controls for whether a person has an MBA or not.
b. Print the data set that allows you to do this regression. Sketch the graph the estimated regression that clearly indicates the impact of a MBA degree on Salary.
c. What is the market value of the MBA degree?
Person Salary Experience
1 $130,468 10 Years
2 $62,250 1
3 $50,000 2.3
4 $140,000 9
5 $110,000 8
6 $80,050 2.8
7 $95,772 7
8 $110,000 6
9 $87,752 4.2
10 $79,290 5
The following table shows the past two years of quarterly sales information. Assume that there are both trend and seasonal factors and that the seasonal cycle is one year.
QUARTER
SALES
1
220
2
232
3
201
4
193
5
163
6
194
7
155
8
136
Use regression and seasonal indexes to forecast quarterly sales for the next year.
Note: Do not round intermediate calculations. Round your answers to the nearest whole number.
Chapter 17 Solutions
Mindtapv2.0 For Anderson/sweeney/williams/camm/cochran's Modern Business Statistics With Microsoft Excel, 1 Term Printed Access Card (mindtap Course List)
Ch. 17.2 - 1. Consider the following time series...Ch. 17.2 - 2. Refer to the time series data in exercise 1....Ch. 17.2 - Prob. 3ECh. 17.2 - 4. Consider the following time series...Ch. 17.3 - Consider the following time series...Ch. 17.3 - Consider the following time series...Ch. 17.3 - Refer to the gasoline sales time series data in...Ch. 17.3 - Prob. 8ECh. 17.3 - 9. With the gasoline time series data from Table...Ch. 17.3 - 10. With a smoothing constant of α = .2, equation...
Ch. 17.3 - For the Hawkins Company, the monthly percentages...Ch. 17.3 - Corporate triple-A bond interest rates for 12...Ch. 17.3 - The values of Alabama building contracts (in $...Ch. 17.3 - The following time series shows the sales of a...Ch. 17.3 - Ten weeks of data on the Commodity Futures Index...Ch. 17.3 - Prob. 16ECh. 17.4 - Consider the following time series...Ch. 17.4 - Prob. 18ECh. 17.4 - Prob. 19ECh. 17.4 - Prob. 20ECh. 17.4 - Prob. 21ECh. 17.4 - Prob. 22ECh. 17.4 - The president of a small manufacturing firm is...Ch. 17.4 - The following data shows the average interest rate...Ch. 17.4 - Quarterly revenue ($ millions) for Twitter for the...Ch. 17.4 - Giovanni Food Products produces and sells frozen...Ch. 17.4 - The number of users of Facebook from 2004 through...Ch. 17.5 - Consider the following time series.
Construct a...Ch. 17.5 - Consider the following time series...Ch. 17.5 - The quarterly sales data (number of copies sold)...Ch. 17.5 - Air pollution control specialists in southern...Ch. 17.5 - South Shore Construction builds permanent docks...Ch. 17.5 - Prob. 33ECh. 17.5 - Prob. 34ECh. 17.6 - Consider the following time series...Ch. 17.6 - Refer to exercise 35.
Deseasonalize the time...Ch. 17.6 - The quarterly sales data (number of copies sold)...Ch. 17.6 - Three years of monthly lawn-maintenance expenses...Ch. 17.6 - Air pollution control specialists in southern...Ch. 17.6 - Electric power consumption is measured in...Ch. 17 - The weekly demand (in cases) for a particular...Ch. 17 - The following table reports the percentage of...Ch. 17 - United Dairies, Inc., supplies milk to several...Ch. 17 - Annual retail store revenue for Apple from 2007 to...Ch. 17 - The Mayfair Department Store in Davenport, Iowa,...Ch. 17 - Prob. 47SECh. 17 - The Costello Music Company has been in business...Ch. 17 - Consider the Costello Music Company problem in...Ch. 17 - Prob. 50SECh. 17 - Refer to the Costello Music Company time series in...Ch. 17 - Prob. 52SECh. 17 - Refer to the Hudson Marine problem in exercise 52....Ch. 17 - Refer to the Hudson Marine problem in exercise...Ch. 17 - Refer to the Hudson Marine data in exercise...Ch. 17 - Forecasting Food and Beverage Sales
The Vintage...Ch. 17 - The Carlson Department Store suffered heavy damage...
Knowledge Booster


Learn more about
Need a deep-dive on the concept behind this application? Look no further. Learn more about this topic, statistics and related others by exploring similar questions and additional content below.Similar questions
- What does the y -intercept on the graph of a logistic equation correspond to for a population modeled by that equation?arrow_forwardDoes Table 1 represent a linear function? If so, finda linear equation that models the data.arrow_forwardTable 6 shows the year and the number ofpeople unemployed in a particular city for several years. Determine whether the trend appears linear. If so, and assuming the trend continues, in what year will the number of unemployed reach 5 people?arrow_forward
- b. Use a multiple linear regression model with dummy variables as follows to develop an equation to account for seasonal effects in the data: Qtr1 = 1 if quarter 1, 0 otherwise; Qtr2 = 1 if quarter 2, 0 otherwise; Qtr3 = 1 if quarter 3, 0 otherwise. For subtractive or negative numbers use a minus sign even if there is a + sign before the blank. c. Compute the quarterly forecasts for next year.arrow_forwardSuppose a firm has had the following historic sales figures. Year: 2016 2017 2018 2019 2020 Sales $2,570,000 $3,750,000 $4,380,000 $5,010,000 $5,520,000 What would be the forecast for next year’s sales using regression to estimate a trend?arrow_forwardSuppose a firm has had the following historic sales figures. Year: 2016 2017 2018 2019 2020 Sales $2,430,000 $3,650,000 $4,300,000 $5,010,000 $5,660,000 What would be the forecast for next year's sales using regression to estimate a trend? Next year's salesarrow_forward
arrow_back_ios
arrow_forward_ios
Recommended textbooks for you
 Linear Algebra: A Modern IntroductionAlgebraISBN:9781285463247Author:David PoolePublisher:Cengage Learning
 Algebra and Trigonometry (MindTap Course List)AlgebraISBN:9781305071742Author:James Stewart, Lothar Redlin, Saleem WatsonPublisher:Cengage Learning
 Calculus For The Life SciencesCalculusISBN:9780321964038Author:GREENWELL, Raymond N., RITCHEY, Nathan P., Lial, Margaret L.Publisher:Pearson Addison Wesley,
 Glencoe Algebra 1, Student Edition, 9780079039897...AlgebraISBN:9780079039897Author:CarterPublisher:McGraw Hill
 Functions and Change: A Modeling Approach to Coll...AlgebraISBN:9781337111348Author:Bruce Crauder, Benny Evans, Alan NoellPublisher:Cengage Learning
Linear Algebra: A Modern Introduction
Algebra
ISBN:9781285463247
Author:David Poole
Publisher:Cengage Learning
Algebra and Trigonometry (MindTap Course List)
Algebra
ISBN:9781305071742
Author:James Stewart, Lothar Redlin, Saleem Watson
Publisher:Cengage Learning
Calculus For The Life Sciences
Calculus
ISBN:9780321964038
Author:GREENWELL, Raymond N., RITCHEY, Nathan P., Lial, Margaret L.
Publisher:Pearson Addison Wesley,
Glencoe Algebra 1, Student Edition, 9780079039897...
Algebra
ISBN:9780079039897
Author:Carter
Publisher:McGraw Hill
Functions and Change: A Modeling Approach to Coll...
Algebra
ISBN:9781337111348
Author:Bruce Crauder, Benny Evans, Alan Noell
Publisher:Cengage Learning
Time Series Analysis Theory & Uni-variate Forecasting Techniques; Author: Analytics University;https://www.youtube.com/watch?v=_X5q9FYLGxM;License: Standard YouTube License, CC-BY
Operations management 101: Time-series, forecasting introduction; Author: Brandoz Foltz;https://www.youtube.com/watch?v=EaqZP36ool8;License: Standard YouTube License, CC-BY