Concept explainers
Recompute the regression fits from Probs. (a) 17.3 and (b) 17.17, using the matrix approach. Estimate the standard errors and develop 90% confidence intervals for the coefficients.
(a)
To calculate: The coefficient of the regression fit equation of the given databy the use of matrix approach and then calculate standard error and 90% confidence levels for the coefficient.
| x | 0 | 2 | 4 | 6 | 9 | 11 | 12 | 15 | 17 | 19 |
| y | 5 | 6 | 7 | 6 | 9 | 8 | 7 | 10 | 12 | 12 |
Answer to Problem 22P
Solution:
The value of coefficient by the use of matrix approach is 4.8515 and 0.35247, the standard error for the coefficient is 1.065 and 90% confidence levels for the coefficient a0 and a1 is,
[3.6951, 6.0080] and [0.2501, 0.4548]
Explanation of Solution
Given Information:
The data is,
| x | 0 | 2 | 4 | 6 | 9 | 11 | 12 | 15 | 17 | 19 |
| y | 5 | 6 | 7 | 6 | 9 | 8 | 7 | 10 | 12 | 12 |
Calculation:
The coefficient of the regression fit equation can be found out by the Matrix approach by following the below steps,
Step 1. First make Z matrix that contain column of ones in the first column and in the second column x value is shown.
Step 2. Now the coefficient of normal equation is made.
Step 3. Now compute the normal equation of the right hand side that is y data.
Step 4. The coefficient of the model can be found out by taking inverse of the result obtained in step 2 and step 3.
The following MATLAB will perform the desired steps,
On the command window, write this command as,
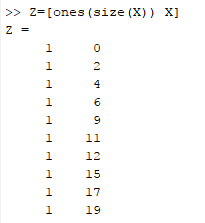
Now, the coefficient of normal equation is calculated as,

Now, the normal equation of y is calculated as,

Finally, the coefficient of the model can be found out,

Therefore, the value of coefficientis 4.8515 and 0.35247.
Now, for calculating the standard error follow these commands,

Now calculate r2 value,
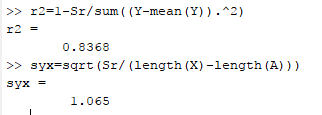
The standard error of the given data is 1.065.
Now for calculating 90% confidence levels for the coefficient, first calculate the inverse of [Z]T[Z] as,

Then the standard error of each coefficient,
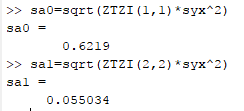
Thevalue of TINV(0.1,10−2)=TINV(0.1,8)=1.8595 is determined by the statistic t value calculator. Therefore, the 90% confidence levels for the coefficient is,
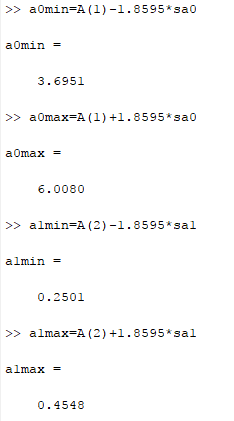
Hence, the 90% confidence levels for the coefficient a0 and a1 is [3.6951, 6.0080] and [0.2501, 0.4548] respectively.
(b)
To calculate: The coefficient of the regression fit cubic equation of the given databy the use of matrix approach and then calculate standard error and 90% confidence levels for the coefficient.
| x | 3 | 4 | 5 | 7 | 8 | 9 | 11 | 12 |
| y | 1.6 | 3.6 | 4.4 | 3.4 | 2.2 | 2.8 | 3.8 | 4.6 |
Answer to Problem 22P
Solution:
The value of coefficient by the use of matrix approach is −11.4887, 7.1438, −1.0412 and 0.0467, the standard error for the coefficient is 0.57 and 90% confidence levels for the coefficient a0,a1,a2 and a3 is,
[−20.0253,−2.9521], [3.0378,11.2498],[−1.6302,−0.4522] and[0.0208, 0.0726].
Explanation of Solution
Given Information:
The data is,
| x | 3 | 4 | 5 | 7 | 8 | 9 | 11 | 12 |
| y | 1.6 | 3.6 | 4.4 | 3.4 | 2.2 | 2.8 | 3.8 | 4.6 |
Calculation:
The coefficient of the regression fit equation can be found out by the Matrix approach by following the below steps,
Step 1. First make Z matrix that contain column of ones in the first column and in the second column x value is shown.
Step 2. Now the coefficient of normal equation is made.
Step 3. Now compute the normal equation of the right hand side that is y data.
Step 4. The coefficient of the model can be found out by taking inverse of the result obtained in step 2 and step 3.
The following MATLAB will perform the desired steps,
On the command window, write this commandfor cubic equation as,
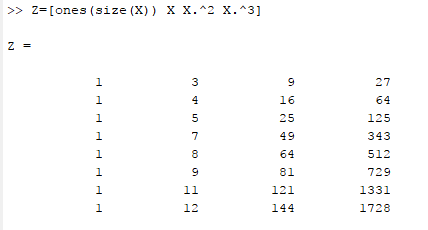
Now, the coefficient of normal equation is calculated as,
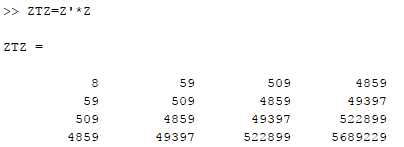
Now, the normal equation of y is calculated as,
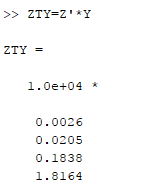
Finally, the coefficient of the model can be found out,
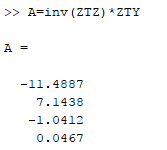
Therefore, the value of coefficient is −11.4887, 7.1438, −1.0412 and 0.0467.
Now, for calculating the standard error follow these commands,
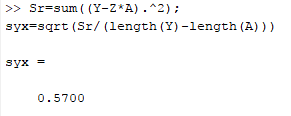
The standard error of the given data is 0.57.
Now for calculating 90% confidence levels for the coefficient, first calculate the inverse of [Z]T[Z] as,
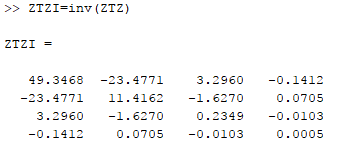
Then the standard error of each coefficient,
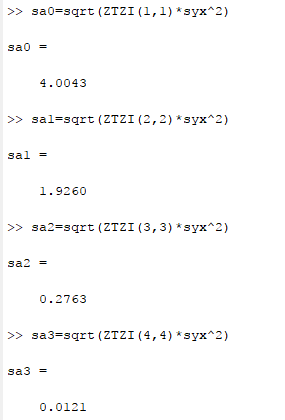
The value of TINV(0.1,8−4)=TINV(0.1,4)=2.13185 is determined by the statistic t value calculator. Therefore, the 90% confidence levels for the coefficient is,
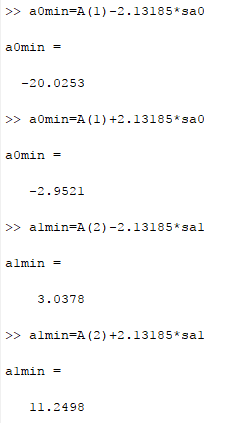
And,
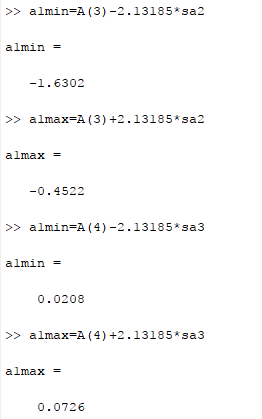
Hence, the 90% confidence levels for the coefficient a0,a1,a2 and a3 is,
[−20.0253,−2.9521], [3.0378,11.2498],[−1.6302,−0.4522] and[0.0208, 0.0726] respectively.
Want to see more full solutions like this?
Chapter 17 Solutions
Numerical Methods for Engineers
- Q Calculate the Fourier series for f(x) = x on the interval -16≤x≤ Tarrow_forwardFind all positive integers n such that n.2n +1 is a square.arrow_forwardA straight-line H is tangent to the function g(x)=-6x-3+ 8 and passes through the point (- 4,7). Determine, the gradient of the straight-line Choose.... y-intercept of the straight-line Choose... + which of the following is the answers -1.125 -6.72 1.125 7.28 0.07 - 7.28 6.72arrow_forward
- You are required to match the correct response to each statement provided. Another term/word that can be used synonymously to Choose... gradient. A term/phrase that is associated with Arithmetic Progression. Common difference → An identity matrix can be referred to as a Choose... ÷ What is the inequality sign that represents "at most"? VIarrow_forwardAffect of sports on students linked with physical problemsarrow_forward26.1. Locate and determine the order of zeros of the following functions: (a). e2z – e*, (b). z2sinhz, (c). z*cos2z, (d). z3 cosz2.arrow_forward
- 31.5. Let be the circle |+1| = 2 traversed twice in the clockwise direction. Evaluate dz (22 + 2)²arrow_forwardUsing FDF, BDF, and CDF, find the first derivative; 1. The distance x of a runner from a fixed point is measured (in meters) at an interval of half a second. The data obtained is: t 0 x 0 0.5 3.65 1.0 1.5 2.0 6.80 9.90 12.15 Use CDF to approximate the runner's velocity at times t = 0.5s and t = 1.5s 2. Using FDF, BDF, and CDF, find the first derivative of f(x)=x Inx for an input of 2 assuming a step size of 1. Calculate using Analytical Solution and Absolute Relative Error: = True Value - Approximate Value| x100 True Value 3. Given the data below where f(x) sin (3x), estimate f(1.5) using Langrage Interpolation. x 1 1.3 1.6 1.9 2.2 f(x) 0.14 -0.69 -0.99 -0.55 0.31 4. The vertical distance covered by a rocket from t=8 to t=30 seconds is given by: 30 x = Loo (2000ln 140000 140000 - 2100 9.8t) dt Using the Trapezoidal Rule, n=2, find the distance covered. 5. Use Simpson's 1/3 and 3/8 Rule to approximate for sin x dx. Compare the results for n=4 and n=8arrow_forward1. A Blue Whale's resting heart rate has period that happens to be approximately equal to 2π. A typical ECG of a whale's heartbeat over one period may be approximated by the function, f(x) = 0.005x4 2 0.005x³-0.364x² + 1.27x on the interval [0, 27]. Find an nth-order Fourier approximation to the Blue Whale's heartbeat, where n ≥ 3 is different from that used in any other posts on this topic, to generate a periodic function that can be used to model its heartbeat, and graph your result. Be sure to include your chosen value of n in your Subject Heading.arrow_forward
 Big Ideas Math A Bridge To Success Algebra 1: Stu...AlgebraISBN:9781680331141Author:HOUGHTON MIFFLIN HARCOURTPublisher:Houghton Mifflin Harcourt
 Trigonometry (MindTap Course List)TrigonometryISBN:9781305652224Author:Charles P. McKeague, Mark D. TurnerPublisher:Cengage Learning
 Elementary Linear Algebra (MindTap Course List)AlgebraISBN:9781305658004Author:Ron LarsonPublisher:Cengage Learning
- Algebra & Trigonometry with Analytic GeometryAlgebraISBN:9781133382119Author:SwokowskiPublisher:Cengage
 College AlgebraAlgebraISBN:9781305115545Author:James Stewart, Lothar Redlin, Saleem WatsonPublisher:Cengage Learning
 Algebra and Trigonometry (MindTap Course List)AlgebraISBN:9781305071742Author:James Stewart, Lothar Redlin, Saleem WatsonPublisher:Cengage Learning


