
Concept explainers
Videos
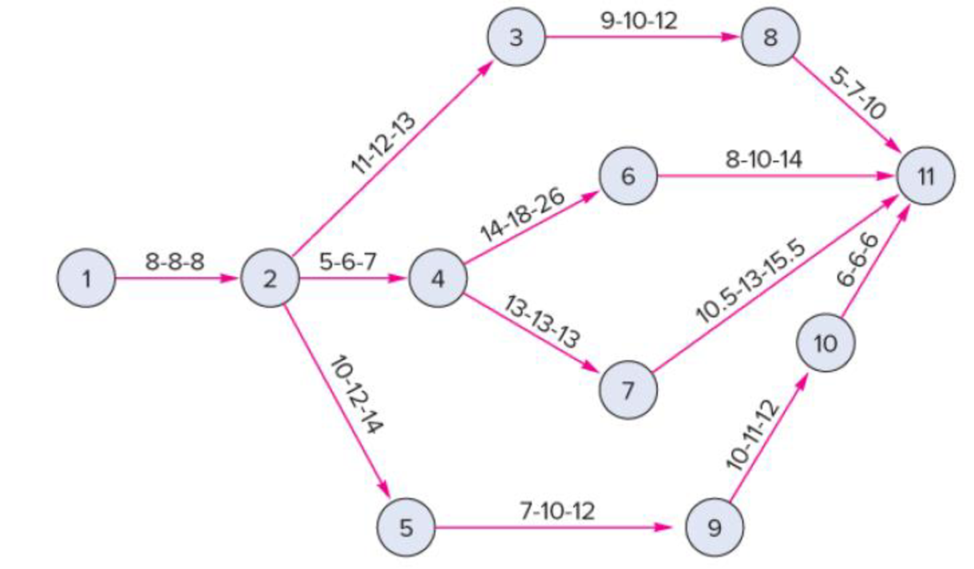
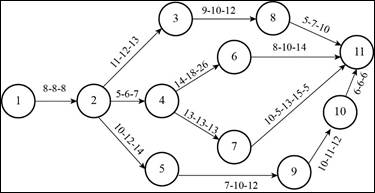
The following precedence diagram reflects three time estimates in weeks for each activity. Determine:
a. The expected completion time for each path and its variance.
b. The probability that the project will require more than 49 weeks.
c. The probability that the project can be completed in 46 weeks or less.
a)
To determine: The expected completion time for each path and its variance.
Explanation of Solution
Given information:
| Activity | Optimistic time | Most likely time | Pessimistic time |
| 1 to 2 | 8 | 8 | 8 |
| 2 to 3 | 11 | 12 | 13 |
| 2 to 4 | 5 | 6 | 7 |
| 2 to 5 | 10 | 12 | 14 |
| 3 to 8 | 9 | 10 | 12 |
| 4 to 6 | 14 | 18 | 26 |
| 4 to 7 | 13 | 13 | 13 |
| 5 to 9 | 7 | 10 | 12 |
| 6 to 11 | 8 | 10 | 14 |
| 7 to 11 | 10.5 | 13 | 15.5 |
| 8 to 11 | 5 | 7 | 10 |
| 9 to 10 | 10 | 11 | 12 |
| 10 to 11 | 6 | 6 | 6 |
Formula to calculate expected time and variance:
Calculation of mean and variance:
| Activity | Optimistic time | Most likely time | Pessimistic time | Expected time | Standard deviation | Variance |
| A | B | C | (A+(4*B)+C)/6 | (C-A)/6 | (C-A)^2/6^2 | |
| 1 to 2 | 8 | 8 | 8 | 8 | 0.000 | 0.000 |
| 2 to 3 | 11 | 12 | 13 | 12 | 0.333 | 0.111 |
| 2 to 4 | 5 | 6 | 7 | 6 | 0.333 | 0.111 |
| 2 to 5 | 10 | 12 | 14 | 12 | 0.667 | 0.444 |
| 3 to 8 | 9 | 10 | 12 | 10.17 | 0.500 | 0.250 |
| 4 to 6 | 14 | 18 | 26 | 18.67 | 2.000 | 4.000 |
| 4 to 7 | 13 | 13 | 13 | 13 | 0.000 | 0.000 |
| 5 to 9 | 7 | 10 | 12 | 9.83 | 0.833 | 0.694 |
| 6 to 11 | 8 | 10 | 14 | 10.33 | 1.000 | 1.000 |
| 7 to 11 | 10.5 | 13 | 15.5 | 13 | 0.833 | 0.694 |
| 8 to 11 | 5 | 7 | 10 | 7.17 | 0.833 | 0.694 |
| 9 to 10 | 10 | 11 | 12 | 11 | 0.333 | 0.111 |
| 10 to 11 | 6 | 6 | 6 | 6 | 0.000 | 0.000 |
Calculation of expected duration, variance and standard deviation for each path:
Path 1-2-3-8-11:
Path 1-2-4-6-11:
Path 1-2-4-7-11:
Path 1-2-5-9-11:
b)
To determine: The probability that the project will require more than 49 weeks.
Answer to Problem 11P
Explanation of Solution
Calculation of probability of completion in more than 49 weeks:
Calculation of z value for all paths:
Formula:
Greater than 49 weeks:
Path 1-2-3-8-11:
Since z value is greater than +3.00, probability of completion is 1.00.
Path 1-2-4-6-11:
From the standard normal distribution table,
The probability value for (z = 2.261) is 0.9960.
Path 1-2-4-7-11:
Since z value is greater than +3.00, probability of completion is 1.00.
Path 1-2-5-9-10-11:
From the standard normal distribution table,
The probability value for (z = 1.94) is 0.9738.
Probability of completion in less than or equal to 49 weeks:
Calculation of probability of completion in greater than 49 weeks:
The probability that the project will require more than 49 weeks is 0.0301.
c)
To determine: The probability that the project will be completed in 46 weeks or less.
Answer to Problem 11P
Explanation of Solution
Calculation of probability of completion in 46 weeks or less:
Calculation of z value for all paths:
Formula:
Path 1-2-3-8-11:
Since z value is greater than +3.00, probability of completion is 1.00.
Path 1-2-4-6-11:
From the standard normal distribution table,
The probability value for (z = 1.33) is 0.9082.
Path 1-2-4-7-11:
Since z value is greater than +3.00, probability of completion is 1.00.
Path 1-2-5-9-10-11:
From the standard normal distribution table,
The probability value for (z = -0.74) is 0.2296.
Probability of completion in less than or equal to 46 weeks:
The probability that the project will be completed in 46 weeks or less is 0.2085.
Want to see more full solutions like this?
Chapter 17 Solutions
EBK OPERATIONS MANAGEMENT


- (a) Draw a project network. (b) Determine the expected time and variance for each activity. (c) Determine earliest start time (ES), earliest finish time (EF), latest start time (LS), finish time (LF) and slack of each activity. (d) Find the critical path and the project completion time. (e) What is the probability that the project will be completed in 65 weeks?arrow_forwardThe following table shows estimates of activity times (in weeks) for a project: b. What is the probability that the project will be completed within 33 weeks? c. What is the probability that the project will be completed in more than 34 weeks? Activity d. What is the probability that the project will be completed in 35 weeks? ABCDEFG А G Optimistic Most Probable Time Time 5 6 3.5 4 3 6 7 5 9 4 6.5 Suppose that the critical path is A-C-E-F-G. Use Appendix A to answer the questions. Do not round intermediate calculations. Round your answers to three decimal places. a. What is the probability that the project will be completed within 36 weeks? 6 10.5 Pessimistic Time 7 4.5 5 10 9 7 15arrow_forwardThe following estimates of activity times (in days) are available for a small project: Activity Optimistic Most Probable Pessimistic A 4 5.0 6 B 8 9.0 10 C 7 7.5 11 D 7 9.0 10 E 6 7.0 9 F 5 6.0 7 An analyst determined that the critical path consists of activities B-D-F. Compute the expected project completion time and the variance of this path. What is the probability the project will be completed in 25 days?arrow_forward
- Develop a project network. Determine the expected project completion time. What is the probability that the project completion time will be completed? With in 2 weeks earlier than the expected project completion time? With in 1.5 week more than the expected project completion time ?arrow_forwardBy using Bar chart planning method, find the following: - Total duration for the project activities shown below - The project completion date (assume the start date is 1/3/2012 Activity A CDEFGHI J Duration 85 2846 7 45 6 (days) Following Activity C,D EFGHIJJ * If the project shown above had a delay of (4 days after (13working days), what would its new delivery date be? B Barrow_forwardActivities, preceding activities, normal and crashed completion times of each of the activities and crashed costs of activities per week of a project are given in the following table. Activity Preceding Activity Normal Crashed Completion time (week) Crashed Cost Completion Time (week) 7 per week A 7 B $500 C 4 3 $700 $600 A A, C В, D D, E D 7 E F 10 9. $800 9 8 $400 i. Draw the network diagram linking all the activities in a way that it shows if there exist any preceding activity/activities before starting each of the mentioned activities in the above table. ii. Find the earliest start time, the earliest finish time, the latest start time and the latest finish time of each of the activities in the drawn diagram of the project and hence the completion time of the project and the critical path.arrow_forward
- Consider the office renovation project data in Table 7.16. A“zero” time estimate means that the activity could take a verysmall amount of time and should be treated as a numericzero in the analysis.a. Based on the critical path, find the probability ofcompleting the office renovation project by 39 days.b. Find the date by which you would be 90 percent sure ofcompleting the project.arrow_forwardConsider the project described in the table below: Activity Duration A B C D E F G H 9 4 8 8 5 7 4 6 OEST-9 and LCT = 15 OEST=9 and LCT = 13 Immediate Predecessor What is the earliest start time (EST) and latest completion time (LCT) of activity B? OEST=9 and LCT = 20 OEST-9 and LCT-17 - A A A B B,C C,D E,F,Garrow_forwardDoug Casey is in charge of planning and coordinating next spring’s sales management training program for his company. Doug listed the following activity information for this project: A. Draw a project network. B. What are the critical activities and what is the expected project completion time? C. If Doug wants a 0.99 probability of completing the project on time, how far ahead of the scheduled meeting date should he begin working on the project?arrow_forward
- a) Determine the expected completion time and variance for each activity. b) Determine the total project completion time and the critical path for the project. c) Determine ES, EF, LS, LF, and slack for each activity. d) What is the probability that Kelle Carpet and Trim will finish the project in 40 days or less?arrow_forwardThe following estimates of activity times (in days) are available for a small project: Activity Optimistic Most Probable Pessimistic A 4 5.0 6 B 8 9.0 10 C 7 7.5 11 D 7 9.0 10 E 6 7.0 9 F 5 6.0 7 Compute the expected activity completion times and the variance for each activity. An analyst determined that the critical path consists of activities B-D-F. Compute the expected project completion time and the variance of this path.arrow_forwardThe Farmer's American Bank of Leesburg is planning to install a new computerized accounts system. Bank management has determined the activities required to complete the project, the precedence relationships of the activities, and activity time estimates, as shown in the following table. Use POM- QM to analyze this project. According to the result of POM-QM, the expected project completion time is (type number only, no text) Activity a b C d C f 8 k Activity Description Position recruiting System development System training Equipment training Manual system test Preliminary system changeover Computer-personnel interface Equipment modification Equipment testing System debugging and installation Equipment changeover Activity Predecessor a a b, c b, c d, e d, e h f.g a 5 3 4 5 I 1 3 Time Estimates (weeks) 1 1 2 5 m 8 12 7 8 I 4 6 2.5 1. 2 8 b 17 15 10 23 1 13 9 7 1 2 11arrow_forward
 Practical Management ScienceOperations ManagementISBN:9781337406659Author:WINSTON, Wayne L.Publisher:Cengage,
 Operations ManagementOperations ManagementISBN:9781259667473Author:William J StevensonPublisher:McGraw-Hill Education
 Operations and Supply Chain Management (Mcgraw-hi...Operations ManagementISBN:9781259666100Author:F. Robert Jacobs, Richard B ChasePublisher:McGraw-Hill Education
 Purchasing and Supply Chain ManagementOperations ManagementISBN:9781285869681Author:Robert M. Monczka, Robert B. Handfield, Larry C. Giunipero, James L. PattersonPublisher:Cengage Learning
 Production and Operations Analysis, Seventh Editi...Operations ManagementISBN:9781478623069Author:Steven Nahmias, Tava Lennon OlsenPublisher:Waveland Press, Inc.