
Basic Business Statistics, Student Value Edition
14th Edition
ISBN: 9780134685113
Author: Mark L. Berenson, David M. Levine, David F. Stephan, Kathryn Szabat
Publisher: PEARSON
expand_more
expand_more
format_list_bulleted
Videos
Textbook Question
Chapter 16, Problem 16PS
The data shown in the following table and stored in Solar Power represent the yearly amount of solar power generated by utilities (in millions of kWh) in the United States from 2002 through 2016:
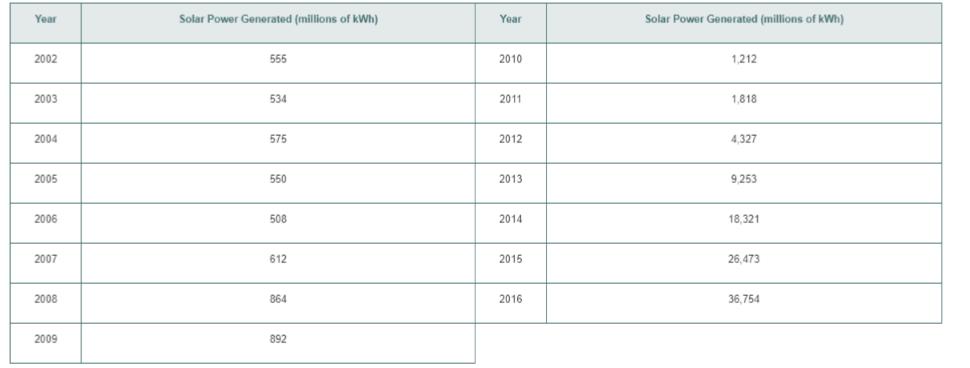
a. Plot the data.
b. Compute a linear trend forecasting equation and plot the trend line.
c. Compute a quadratic trend forecasting equation and plot the results.
d. Compute an exponential trend forecasting equation and plot the results.
e. Using the models in (b) through (d), what are your annual trend forecasts of the yearly amount of solar power generated by utilities (in millions of kWh) in the United Status in 2017 and 2018.
Expert Solution & Answer
Want to see the full answer?
Check out a sample textbook solution
Students have asked these similar questions
The percentage of automobile consumers who are under 50 years of age decreased approximately linearly from
55.955.9%
in
19701970
to
52.652.6%
in
19801980.
a. Predict when the percentage will be
4848%.
b. Predict the percentage in
19851985.
a. The percentage will be
4848%
around the year
The Pennsylvania State University had enrollments of 40,571 students in 2000 and 41,289 students in 2004 at its main campus in University Park, Pennsylvania. Assuming the enrollment growth is linear, predict the enrollments in 2008 and 2010.
1. Make a scatter plot of the table provided in the image.
B. Write a linear/exponential equation that models this table provided in the image.
C. Explain what the slope/multiplier means in the context of the problem.
E. Use your model to predict when there will be 100 new cases
Chapter 16 Solutions
Basic Business Statistics, Student Value Edition
Ch. 16 - If you are using exponential smoothing for...Ch. 16 - Consider a nine-year moving average used to smooth...Ch. 16 - You are using exponential smoothing on an annual...Ch. 16 - Prob. 4PSCh. 16 - Prob. 5PSCh. 16 - How have stocks performed in the past? The...Ch. 16 - Prob. 7PSCh. 16 - Prob. 8PSCh. 16 - Prob. 9PSCh. 16 - Prob. 10PS
Ch. 16 - The linear trend forecasting equation for an...Ch. 16 - There has been much publicity about bounces paid...Ch. 16 - Prob. 13PSCh. 16 - Prob. 14PSCh. 16 - Prob. 15PSCh. 16 - The data shown in the following table and stored...Ch. 16 - Prob. 17PSCh. 16 - Prob. 18PSCh. 16 - Prob. 19PSCh. 16 - Prob. 20PSCh. 16 - Prob. 21PSCh. 16 - Prob. 22PSCh. 16 - You are given an annual time series with 40...Ch. 16 - Prob. 24PSCh. 16 - Prob. 25PSCh. 16 - Prob. 26PSCh. 16 - Prob. 27PSCh. 16 - Prob. 28PSCh. 16 - Prob. 29PSCh. 16 - Using the average baseball salary from 200 through...Ch. 16 - Using the yearly amount of solar power generated...Ch. 16 - The following residuals are from a linear trend...Ch. 16 - Prob. 33PSCh. 16 - Prob. 34PSCh. 16 - Prob. 35PSCh. 16 - Prob. 36PSCh. 16 - Prob. 37PSCh. 16 - Prob. 38PSCh. 16 - Prob. 39PSCh. 16 - Prob. 40PSCh. 16 - In forecasting daily time-series data, how many...Ch. 16 - In forecasting a quarterly time series over the...Ch. 16 - Prob. 43PSCh. 16 - Prob. 44PSCh. 16 - Are gasoline prices higher during the height of...Ch. 16 - Prob. 46PSCh. 16 - Prob. 47PSCh. 16 - The file Silver-Q contains the price in London for...Ch. 16 - Prob. 49PSCh. 16 - What is a time series?Ch. 16 - What are the different components of a time-series...Ch. 16 - What is the difference between moving average and...Ch. 16 - Prob. 53PSCh. 16 - How does the least-squares linear trend...Ch. 16 - How does autoregressive modelling differ from the...Ch. 16 - What are the different approaches to choosing an...Ch. 16 - What is the major difference between using SYX and...Ch. 16 - How does forecasting for monthly or quarterly data...Ch. 16 - Prob. 60PSCh. 16 - The monthly commercial and residential prices for...Ch. 16 - The data stored in McDonalds represent the gross...Ch. 16 - Teachers’ Retirement System of the City of New...Ch. 16 - Prob. 64PS
Knowledge Booster


Learn more about
Need a deep-dive on the concept behind this application? Look no further. Learn more about this topic, statistics and related others by exploring similar questions and additional content below.Similar questions
- Does Table 1 represent a linear function? If so, finda linear equation that models the data.arrow_forwardTable 6 shows the year and the number ofpeople unemployed in a particular city for several years. Determine whether the trend appears linear. If so, and assuming the trend continues, in what year will the number of unemployed reach 5 people?arrow_forwardDoes a linear, exponential, or logarithmic model best fit the data in Table 2? Find the model.arrow_forward
- What does the y -intercept on the graph of a logistic equation correspond to for a population modeled by that equation?arrow_forwardThe average levels of particulate matter (PM2.5) a key cause of adverse health. Effects associated with air pollution have decreased in Toronto from 8.7 μg/m3 in 2014 to 7.0 in 2016. Assuming this trend continues as a linear relationship, what would we expect the levels of PM2.5 to be in the year 2022?arrow_forwardThe global mean sea level variations taken from satellite observations in the month of May are given in the table below. The variations are calculated using the base May 1997. for example, the mean sea level in May 2008 was 34.37 mm higher than in May 1997. Find the linear model for the data and use it to predict the change in sea level for the year in 2017. year 1997 1999 2001 2005 2008 2012 2014 Sea level change (mm) 0 4.77 15.25 30.75 34.37 47.84 54.13 A)what method will you use to find the model, polynomial interolation or least squares, why? b) write the equation that must be used to find the model and then write the system of equations. c) wirte the vandermonde matrix and the other matrices that must be used. e) write the MatLab formula to find the model. f) wirte the cubic model(find the values using MatLab)arrow_forward
- The data lists the average gestation period (in days) and longevity (in years) for a sample of animals, as reported in The World Almanac and Book of Facts 2006. A ferret has a longevity of around 9 years and 75 years. Use the model to predict the gestation period of a ferret.arrow_forwardUnemployment rates for a certain country are published at the end of every month. For the period October, 2019 through January, 2020, the unemployment rates were 7.5% (Oct.), 7.3% (Nov.), 7.1% (Dec), and 6.9% (Jan). Assume the unemployment rates will continue to decrease following a linear model. (a) Predict the unemployment rate at the end of March, 2021. (b) Predict when the country will reach a zero unemployment rate. (a) The unemployment rate at the end of March, 2021 will be (Type an integer or a decimal)arrow_forwardYou are interested in studying the relationship between dietary fat intake and pubertal onset. a. Define Cofounder b. Identify at least 3 potential variables that may confound the primary relationship of interest.arrow_forward
arrow_back_ios
arrow_forward_ios
Recommended textbooks for you
 Calculus For The Life SciencesCalculusISBN:9780321964038Author:GREENWELL, Raymond N., RITCHEY, Nathan P., Lial, Margaret L.Publisher:Pearson Addison Wesley,

 Trigonometry (MindTap Course List)TrigonometryISBN:9781337278461Author:Ron LarsonPublisher:Cengage Learning
 Glencoe Algebra 1, Student Edition, 9780079039897...AlgebraISBN:9780079039897Author:CarterPublisher:McGraw Hill
 Algebra & Trigonometry with Analytic GeometryAlgebraISBN:9781133382119Author:SwokowskiPublisher:Cengage
Calculus For The Life Sciences
Calculus
ISBN:9780321964038
Author:GREENWELL, Raymond N., RITCHEY, Nathan P., Lial, Margaret L.
Publisher:Pearson Addison Wesley,
Trigonometry (MindTap Course List)
Trigonometry
ISBN:9781337278461
Author:Ron Larson
Publisher:Cengage Learning
Glencoe Algebra 1, Student Edition, 9780079039897...
Algebra
ISBN:9780079039897
Author:Carter
Publisher:McGraw Hill
Algebra & Trigonometry with Analytic Geometry
Algebra
ISBN:9781133382119
Author:Swokowski
Publisher:Cengage
Time Series Analysis Theory & Uni-variate Forecasting Techniques; Author: Analytics University;https://www.youtube.com/watch?v=_X5q9FYLGxM;License: Standard YouTube License, CC-BY
Operations management 101: Time-series, forecasting introduction; Author: Brandoz Foltz;https://www.youtube.com/watch?v=EaqZP36ool8;License: Standard YouTube License, CC-BY