
Concept explainers
Videos
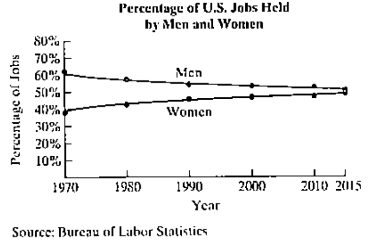
The graphs show the percentage of jobs m the U.S. lobar force held by men and by women from 1970 through 2015. Exercises 109-110 are based on the data displayed by the graphs.
The formula
models the percentage of jobs in the U.S. labor force, p, held by men years after 1970.
a. Use the appropriate graph at the bottom of the previous column to estimate the percentage of jobs in the U.S-labor force held by men in 2010. Give your estimation lo the nearest percent.
b. Use the mathematical model to determine the percentage of jobs in the US. labor force held by men in 2010. Round to the nearest tenth of a percent.
c. According to the formula, when will 4"% of jobs in the U.S. labor force be held by men? Round to the nearest year.
Want to see the full answer?
Check out a sample textbook solution
Chapter 1 Solutions
Algebra and Trigonometry (6th Edition)


 Trigonometry (MindTap Course List)TrigonometryISBN:9781337278461Author:Ron LarsonPublisher:Cengage Learning
 Algebra: Structure And Method, Book 1AlgebraISBN:9780395977224Author:Richard G. Brown, Mary P. Dolciani, Robert H. Sorgenfrey, William L. ColePublisher:McDougal Littell
 Glencoe Algebra 1, Student Edition, 9780079039897...AlgebraISBN:9780079039897Author:CarterPublisher:McGraw Hill
 Algebra & Trigonometry with Analytic GeometryAlgebraISBN:9781133382119Author:SwokowskiPublisher:Cengage