
Videos
Exercise 17 demonstrates that the results of the signed-rank test may be misleading when the assumption of symmetry is violated.
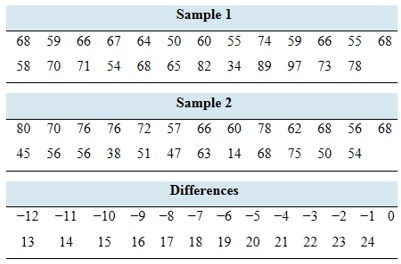
Asymmetric differences: Consider the following paired samples and their differences.
- Verify that the median of the sample differences is equal to 0.
- Compute the test statistic for the signed-rank test.
- Do you reject the null hypothesis that the median is equal to 0? Use the
a.
To verify:The median of the sample difference is
Explanation of Solution
Given information:
The level of significance is
| Sample 1 | ||||||||||
| 68 | 59 | 66 | 67 | 64 | 50 60 55 | 74 | 59 | 66 | 55 | 68 |
| 58 | 70 | 71 | 54 | 68 | 65 82 34 | 89 | 97 | 73 | 78 | |
| Sample 2 | ||||||||||
| 80 | 70 | 76 | 76 | 72 | 57 66 60 | 78 | 62 | 68 | 56 | 68 |
| 45 | 56 | 56 | 38 | 51 | 47 63 14 | 68 | 75 | 50 | 54 | |
Table-1
| Differences | ||||||||||||
| -12 | -11 | -10 | -9 | -8 | -7 | -6 | -5 | -4 | -3 | -2 | -1 | 0 |
| 13 | 14 | 15 | 16 | 17 | 18 | 19 | 20 | 21 | 22 | 23 | 24 | |
Table-2
Calculation:
From Table-2, the sample size is
The median for odd data is,
Substitute the values in above formula.
Since, the thirteenth term of table-2 is zero.
Thus, the median of difference data is
b.
To find:The test statistics.
Answer to Problem 17E
The test statistics is
Explanation of Solution
Given information:
The level of significance is
| Sample 1 | ||||||||||
| 68 | 59 | 66 | 67 | 64 | 50 60 55 | 74 | 59 | 66 | 55 | 68 |
| 58 | 70 | 71 | 54 | 68 | 65 82 34 | 89 | 97 | 73 | 78 | |
| Sample 2 | ||||||||||
| 80 | 70 | 76 | 76 | 72 | 57 66 60 | 78 | 62 | 68 | 56 | 68 |
| 45 | 56 | 56 | 38 | 51 | 47 63 14 | 68 | 75 | 50 | 54 | |
Table-1
| Differences | ||||||||||||
| -12 | -11 | -10 | -9 | -8 | -7 | -6 | -5 | -4 | -3 | -2 | -1 | 0 |
| 13 | 14 | 15 | 16 | 17 | 18 | 19 | 20 | 21 | 22 | 23 | 24 | |
Table-2
Calculation:
The MINITAB output is shown below.
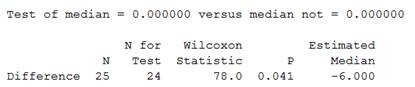
Figure-1
From Figure-1, it is clear that the test statistics is
Therefore, the test statistics is
c.
To find:Whether to reject the null hypothesis.
Answer to Problem 17E
The null hypothesis is rejected.
Explanation of Solution
Given information:
The level of significance is
| Sample 1 | ||||||||||
| 68 | 59 | 66 | 67 | 64 | 50 60 55 | 74 | 59 | 66 | 55 | 68 |
| 58 | 70 | 71 | 54 | 68 | 65 82 34 | 89 | 97 | 73 | 78 | |
| Sample 2 | ||||||||||
| 80 | 70 | 76 | 76 | 72 | 57 66 60 | 78 | 62 | 68 | 56 | 68 |
| 45 | 56 | 56 | 38 | 51 | 47 63 14 | 68 | 75 | 50 | 54 | |
Table-1
| Differences | ||||||||||||
| -12 | -11 | -10 | -9 | -8 | -7 | -6 | -5 | -4 | -3 | -2 | -1 | 0 |
| 13 | 14 | 15 | 16 | 17 | 18 | 19 | 20 | 21 | 22 | 23 | 24 | |
Table-2
Calculation:
The null hypothesis is, the median is equal to zero.
The alternative hypothesis is, the median is not equal to zero.
Since, the test statistics is
For sample size
Since, the test statistics is less than the critical value.
Thus, hypothesis
Therefore, the null hypothesis is rejected.
Want to see more full solutions like this?
Chapter 15 Solutions
Elementary Statistics


 Glencoe Algebra 1, Student Edition, 9780079039897...AlgebraISBN:9780079039897Author:CarterPublisher:McGraw Hill
 Calculus For The Life SciencesCalculusISBN:9780321964038Author:GREENWELL, Raymond N., RITCHEY, Nathan P., Lial, Margaret L.Publisher:Pearson Addison Wesley,