APPLIED STAT.IN BUS.+ECONOMICS
6th Edition
ISBN: 9781259957598
Author: DOANE
Publisher: RENT MCG
expand_more
expand_more
format_list_bulleted
Concept explainers
Textbook Question
Chapter 15.3, Problem 10SE
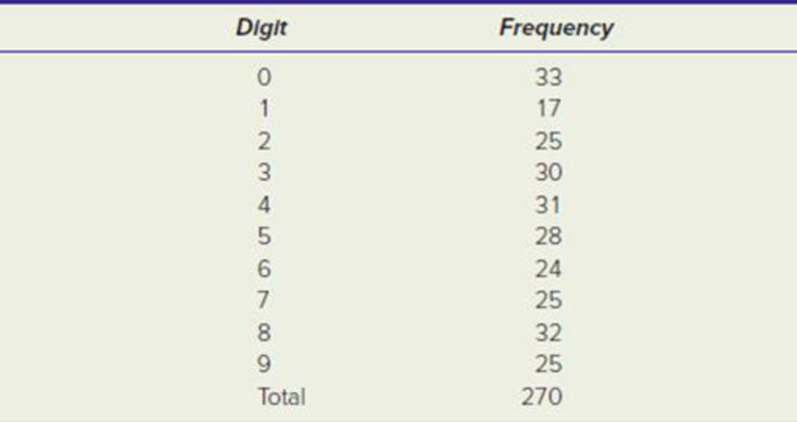
In a three-digit lottery, each of the three digits is supposed to have the same probability of occurrence (counting initial blanks as zeros, e.g., 32 is treated as 032). The table shows the frequency of occurrence of each digit for 90 consecutive daily three-digit drawings. (a) Make a bar chart and describe it. (b) Calculate expected frequencies for each class. (c) Perform the chi-square test for a uniform distribution. At α = .05, can you reject the hypothesis that the digits are from a uniform population?

Expert Solution & Answer
Want to see the full answer?
Check out a sample textbook solution
Students have asked these similar questions
During busy political seasons, many opinion polls are conducted. In apresidential race, how do you think the participants in polls are generally selected?Discuss any issues regarding simple random, stratified, systematic, cluster, andconvenience sampling in these polls. What about other types of polls, besides political?
Please could you explain why 0.5 was added to each upper limpit of the intervals.Thanks
28. (a) Under what conditions do we say that two random variables X and Y are
independent?
(b) Demonstrate that if X and Y are independent, then it follows that E(XY) =
E(X)E(Y);
(e) Show by a counter example that the converse of (ii) is not necessarily true.
Chapter 15 Solutions
APPLIED STAT.IN BUS.+ECONOMICS
Ch. 15.1 - Instructions: For each exercise, include software...Ch. 15.1 - Instructions: For each exercise, include software...Ch. 15.1 - Instructions: For each exercise, include software...Ch. 15.1 - Instructions: For each exercise, include software...Ch. 15.1 - Prob. 5SECh. 15.2 - U.S. market share for smartphones with larger...Ch. 15.2 - Prob. 7SECh. 15.3 - Prob. 8SECh. 15.3 - Prob. 9SECh. 15.3 - In a three-digit lottery, each of the three digits...
Ch. 15.3 - Ages of 56 attendees of a recent Star Wars movie...Ch. 15.4 - Excel was asked to generate 50 Poisson random...Ch. 15.4 - Prob. 13SECh. 15.4 - Prob. 14SECh. 15.5 - Exam scores of 40 students in a statistics class...Ch. 15.5 - One Friday night, there were 42 carry-out orders...Ch. 15.6 - Prob. 17SECh. 15.6 - Prob. 18SECh. 15 - Prob. 1CRCh. 15 - Prob. 2CRCh. 15 - Prob. 3CRCh. 15 - Prob. 4CRCh. 15 - Prob. 5CRCh. 15 - Prob. 6CRCh. 15 - Prob. 7CRCh. 15 - Prob. 8CRCh. 15 - Prob. 9CRCh. 15 - Prob. 10CRCh. 15 - (a) Name potential advantages of the...Ch. 15 - (a) What does a probability plot show? (b) If the...Ch. 15 - (a) Name two advantages of the Anderson-Darling...Ch. 15 - Prob. 19CECh. 15 - Prob. 20CECh. 15 - Prob. 21CECh. 15 - Prob. 22CECh. 15 - Prob. 23CECh. 15 - Prob. 24CECh. 15 - Instructions: In all exercises, include software...Ch. 15 - Prob. 26CECh. 15 - Prob. 27CECh. 15 - Prob. 28CECh. 15 - Prob. 29CECh. 15 - Prob. 30CECh. 15 - Prob. 31CECh. 15 - Prob. 32CECh. 15 - Prob. 33CECh. 15 - Prob. 34CECh. 15 - Prob. 35CECh. 15 - Prob. 36CECh. 15 - Prob. 37CECh. 15 - Prob. 38CECh. 15 - Instructions: In all exercises, include software...Ch. 15 - Instructions: In all exercises, include software...Ch. 15 - Instructions: In all exercises, include software...
Knowledge Booster
Learn more about
Need a deep-dive on the concept behind this application? Look no further. Learn more about this topic, statistics and related others by exploring similar questions and additional content below.Similar questions
- 19. Let X be a non-negative random variable. Show that lim nE (IX >n)) = 0. E lim (x)-0. = >arrow_forward(c) Utilize Fubini's Theorem to demonstrate that E(X)= = (1- F(x))dx.arrow_forward(c) Describe the positive and negative parts of a random variable. How is the integral defined for a general random variable using these components?arrow_forward
- 26. (a) Provide an example where X, X but E(X,) does not converge to E(X).arrow_forward(b) Demonstrate that if X and Y are independent, then it follows that E(XY) E(X)E(Y);arrow_forward(d) Under what conditions do we say that a random variable X is integrable, specifically when (i) X is a non-negative random variable and (ii) when X is a general random variable?arrow_forward
arrow_back_ios
SEE MORE QUESTIONS
arrow_forward_ios
Recommended textbooks for you
 Holt Mcdougal Larson Pre-algebra: Student Edition...AlgebraISBN:9780547587776Author:HOLT MCDOUGALPublisher:HOLT MCDOUGAL
 College Algebra (MindTap Course List)AlgebraISBN:9781305652231Author:R. David Gustafson, Jeff HughesPublisher:Cengage Learning
 Glencoe Algebra 1, Student Edition, 9780079039897...AlgebraISBN:9780079039897Author:CarterPublisher:McGraw HillAlgebra & Trigonometry with Analytic GeometryAlgebraISBN:9781133382119Author:SwokowskiPublisher:Cengage

Holt Mcdougal Larson Pre-algebra: Student Edition...
Algebra
ISBN:9780547587776
Author:HOLT MCDOUGAL
Publisher:HOLT MCDOUGAL

College Algebra (MindTap Course List)
Algebra
ISBN:9781305652231
Author:R. David Gustafson, Jeff Hughes
Publisher:Cengage Learning


Glencoe Algebra 1, Student Edition, 9780079039897...
Algebra
ISBN:9780079039897
Author:Carter
Publisher:McGraw Hill

Algebra & Trigonometry with Analytic Geometry
Algebra
ISBN:9781133382119
Author:Swokowski
Publisher:Cengage
Mod-01 Lec-01 Discrete probability distributions (Part 1); Author: nptelhrd;https://www.youtube.com/watch?v=6x1pL9Yov1k;License: Standard YouTube License, CC-BY
Discrete Probability Distributions; Author: Learn Something;https://www.youtube.com/watch?v=m9U4UelWLFs;License: Standard YouTube License, CC-BY
Probability Distribution Functions (PMF, PDF, CDF); Author: zedstatistics;https://www.youtube.com/watch?v=YXLVjCKVP7U;License: Standard YouTube License, CC-BY
Discrete Distributions: Binomial, Poisson and Hypergeometric | Statistics for Data Science; Author: Dr. Bharatendra Rai;https://www.youtube.com/watch?v=lHhyy4JMigg;License: Standard Youtube License